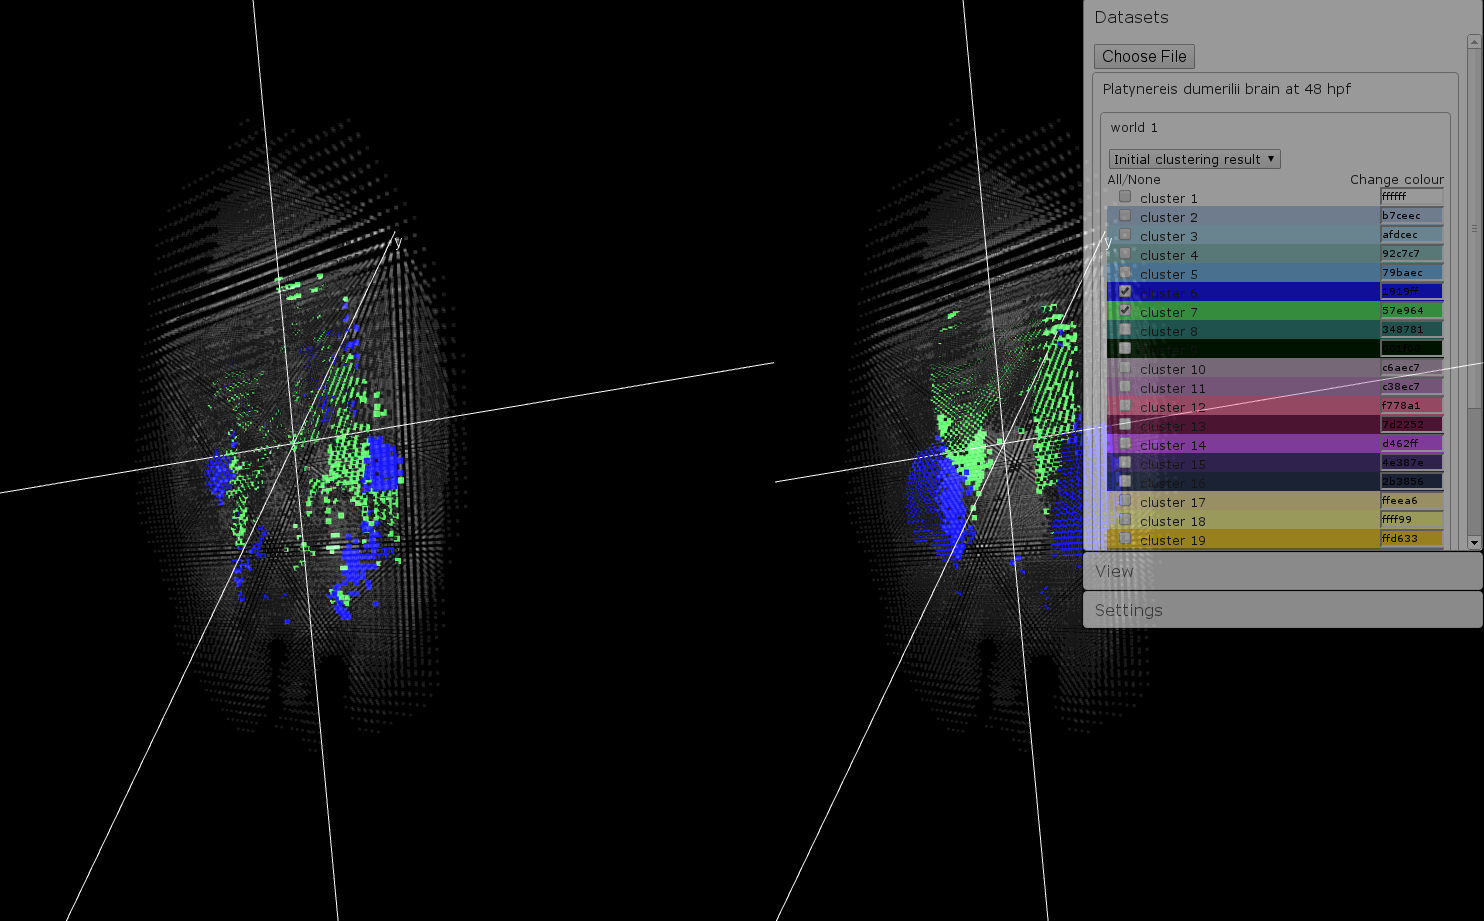
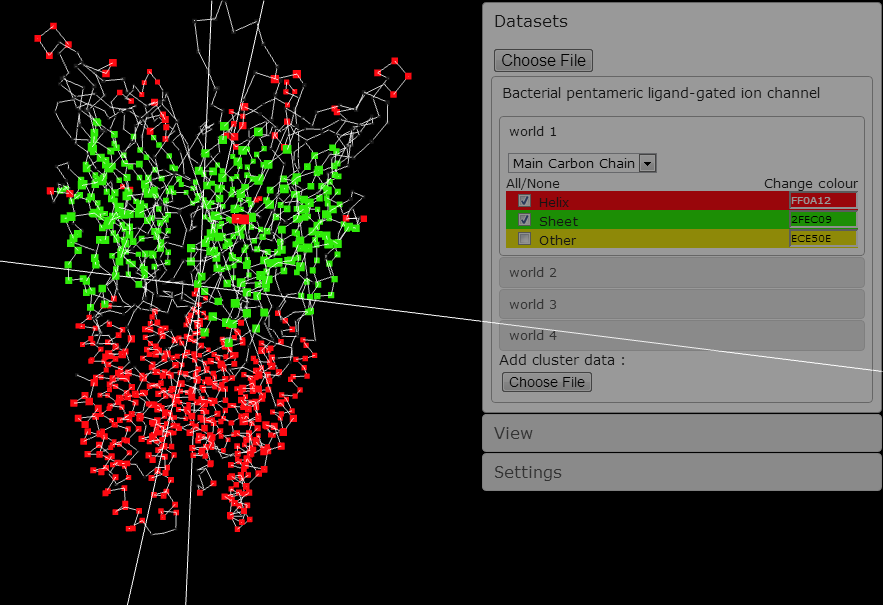
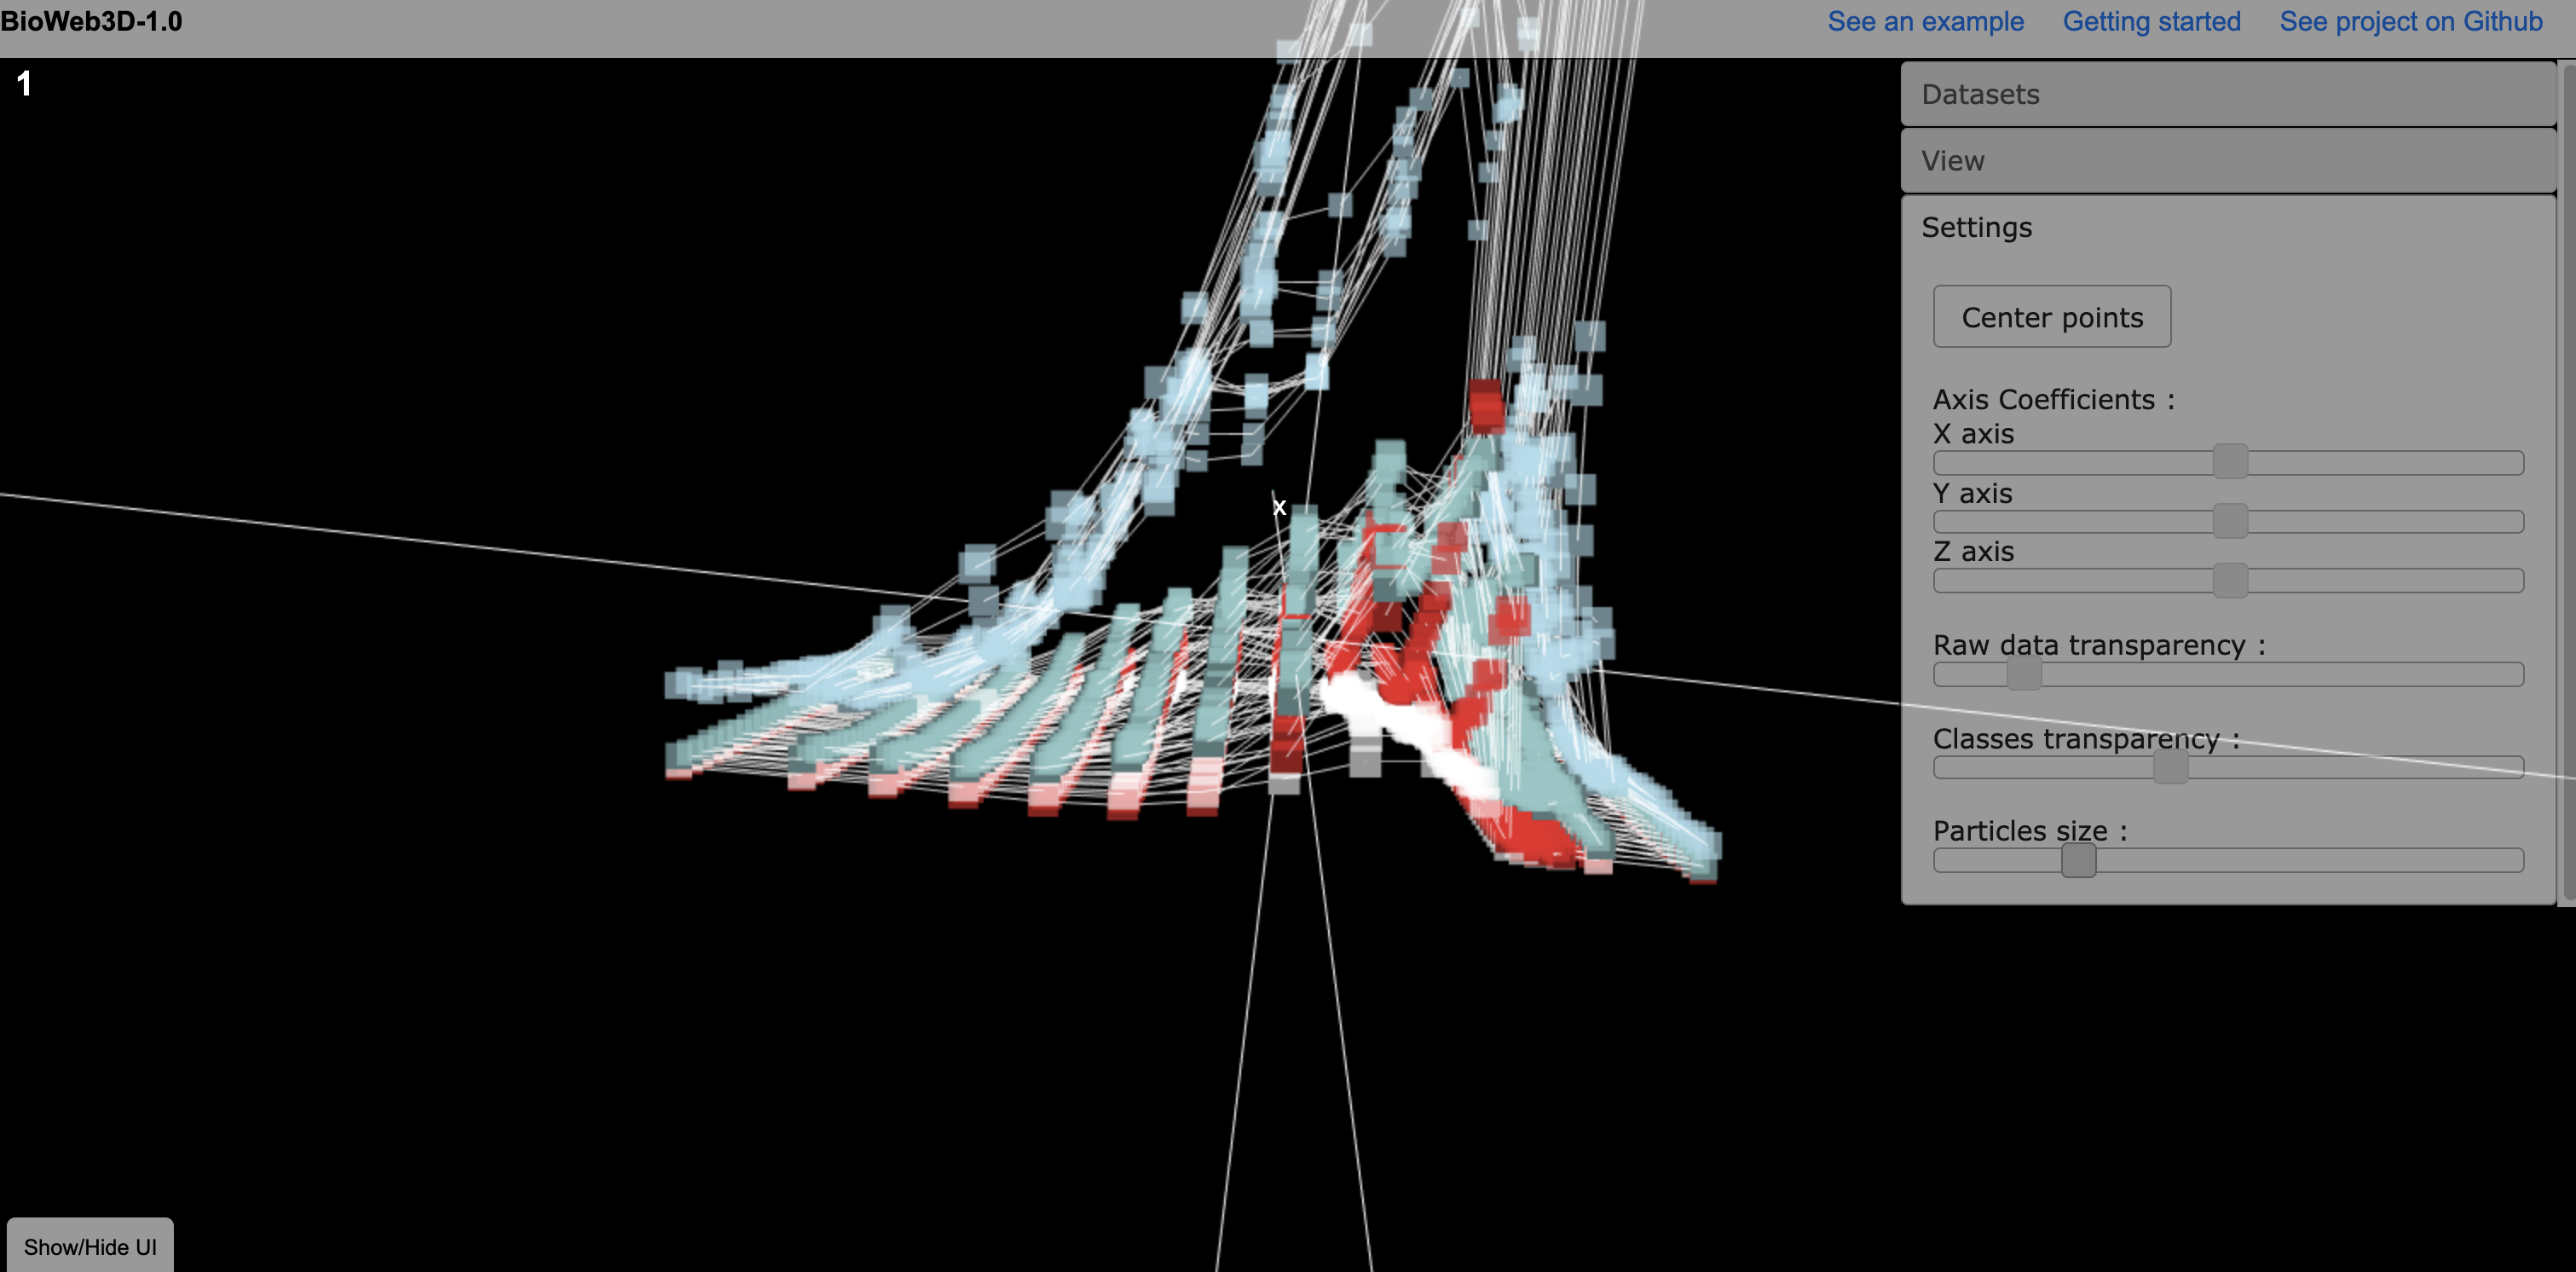
bioWeb3D is an HTML5/webGL based 3D visualisation tool has been developed to allow biologists to quickly and easily view interactive and customizable three dimensional representations of their data along with multiple layers of information. Using the WebGL library Three.js written in Javascript, bioWeb3D allows the simultaneous visualisation of multiple large datasets inputted via a simple JSON file, which can be read and analysed locally thanks to HTML5 capabilities.
Test the application in one click
This example has been created by github user MarcFrankfurt to visualize sex worker arrest data from the US has been added by Arrest Mapper Project. Check out his explanation page !
But remember, you can input any 3D dataset for a quick and interactive visualization ! Want to visualize your data in bioWeb3D ? You should look up the FAQ and the Getting started page
If that's not enough, if you find a bug or if you have any improvement suggestion, please submit an issue report here
Visualisation is a key feature in the analysis of large biological datasets, especially when analysing organized structures with distinct sub-clusters (Rubel et al., 2010). This is particularly important when analysing 3-Dimensional (3D) datasets, which is becoming more and more common. While various visualisation tools have been developed, they have typically been available via a locally installed piece of software such as Arena3D (Pavlopoulos et al.,2008), 3D Genome Tuner (Wang et al., 2009), the Allen Brain Atlas (Lein et al., 2007) or Cytoscape (Shannon et al., 2003). Other 3D visualisation tools have been built online and are accessible through the browser directly, such as AstexViewer (Hartshorn et al., 2002), which is utilised by the Protein Databank Europe via a Java Applet. More recently, visualisation tools developed using HTML5/WebGL capabilities have been described, although they have focused on very specific applications, such as analysing radiology data (Kulkarni et al., 2012). However, no tool has allowed biologists to view their own 3D data directly online in an easy, fast, secure and interactive way. Using webGL and the JavaScript 3D library Three.js, bioWeb3D aims to be a simple, generic, tool for visualising such data.
Hartshorn M.J. (2002). AstexViewer: a visualisation aid for structure-based drug design. Journal of Computer-aided Molecule Design 16:871-881.
Kulkarni D.B., Doijade M.M., Devrukhkar C.S., Zilpe G.R. and Surana R.R. (2012). NetraRIS - a Web based DICOM Viewer. International Journal of Computer Applications.48:40-44.
Lein E.S., Hawrylycz M.J., Ao N., Ayres M., Bensinger A., Bernard A., Boe A.F., Boguski M.S., Brockway K.S., Byrnes E.J., et al.. (2007). Genome-wide atlas of gene expression in the adult mouse brain., Nature, 445:168-176.
Rubel O., Weber G.H., Huang M.Y., Bethel E.W., Biggin M.D., Fowlkes C.C., Luengo Hendriks C.L., Ker ̈ nen S.V., Eisen M.B., Knowles D.W., et al. (2010). Integrating a Data Clustering and visualisation for the Analysis of 3D Gene Expression Data. IEEE/ACM Trans Comput Biol Bioinform, 7:64-79.
Shannon P., Markiel A., Ozier O., Baliga N.S., Wang J.T., Ramage D., Amin N., Schwikowski B., Ideker T. (2003). Cytoscape: a software environment for integrated models of biomolecular interaction networks., Genome Res, 13:2498-2504.
Wang Q., Lianga Q., Zhang X. (2009). 3D Genome Tuner: Compare Multiple Circular Genomes in a 3D Context., Genomics, Proteomics and Bioinformatics, 7:143-146.


