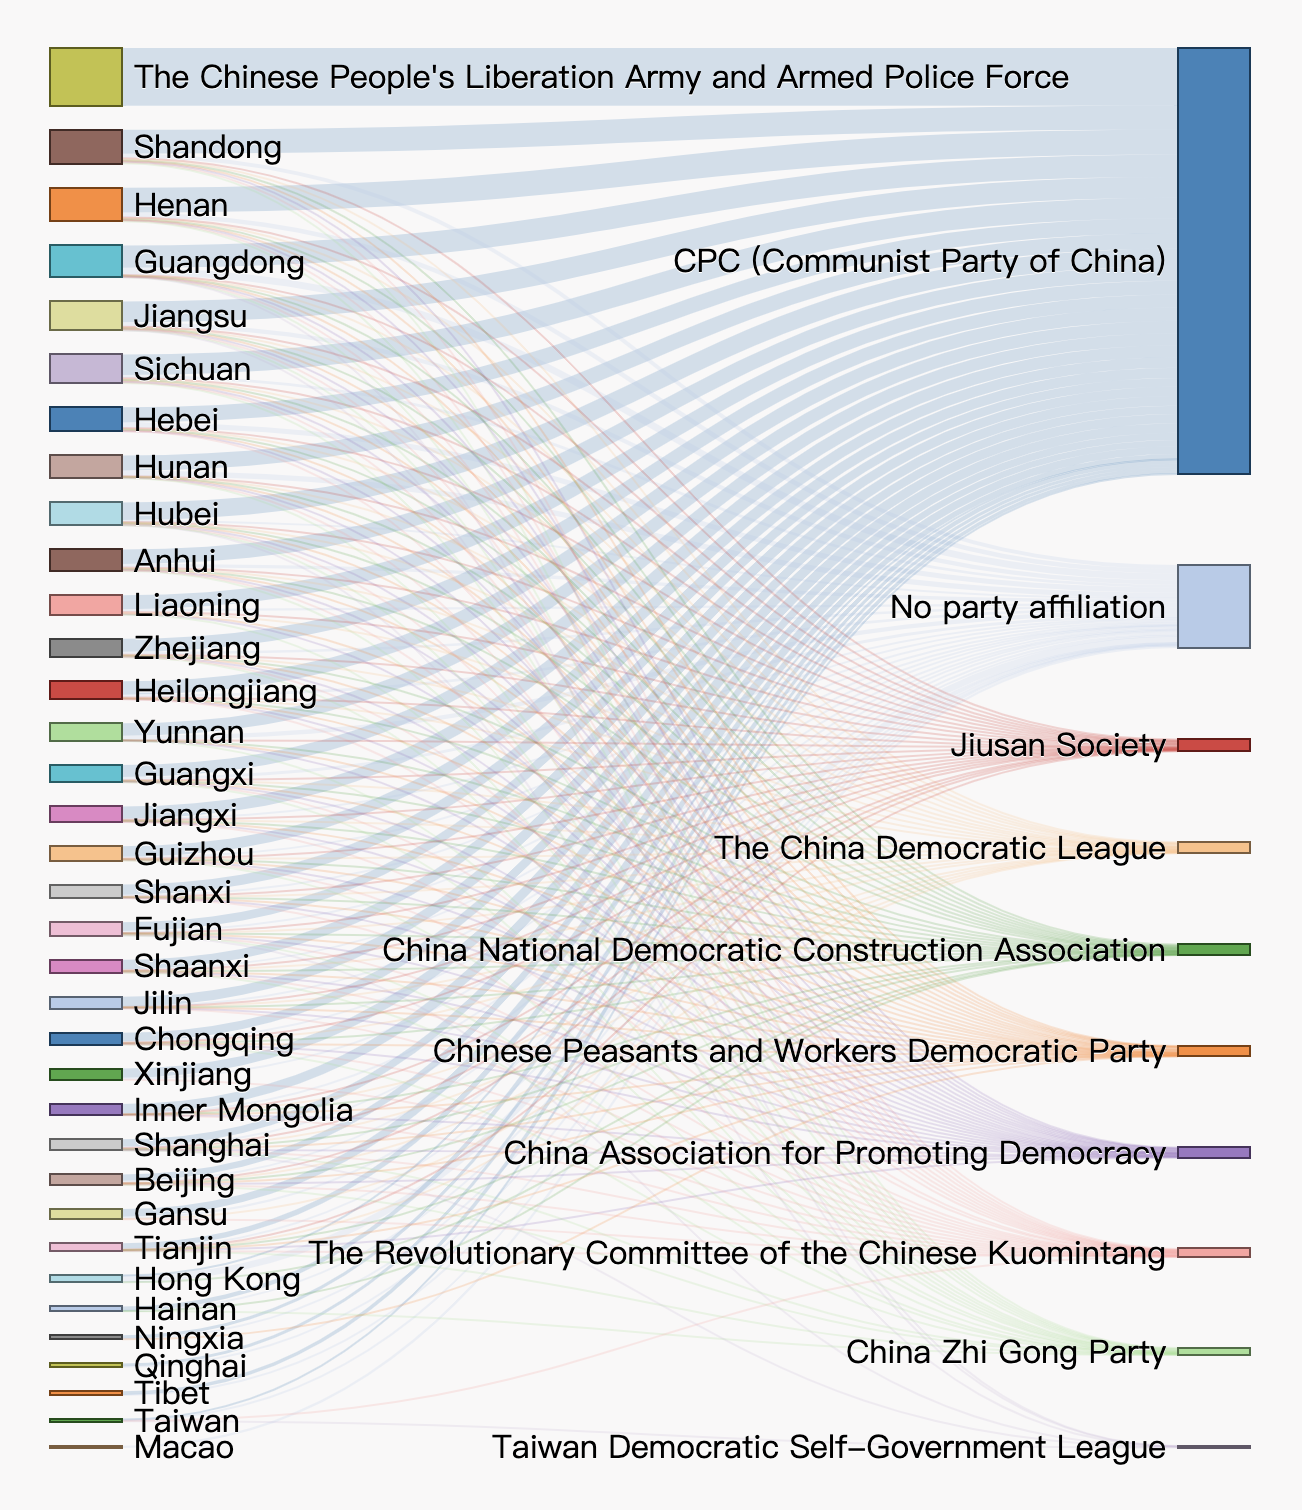
A simple sankey data visualization base on d3's sankey.js. Two dimensions only.
d3.js sankey.js
-
Two dimension split.
-
self defined node size, node color, dimension title and css style.
        var sankeySimple = new SankeySimple(document.getElementById('chart'), {
          data: data,
          // width: 700,
          // height: 800,
          // nodeWidth: 36,
          // nodePadding: 12,
          // margin: { top: 50, right: 50, bottom: 50, left: 50 },
          // leftTitle: 'Delegations',
          // rightTitle: 'Parties',
          // color: d3.scaleOrdinal(d3.schemeCategory20),
}); {
"nodes": [
{ "node": 0, "name": "Anhui", "color": "#9E0142"}, // color is optional
{ "node": 1, "name": "CPC (Communist Party of China)", "color": "#D53E4F"},
{ "node": 2, "name": "Hunan", "color": "#F46D43" },
{ "node": 3, "name": "No party affiliation", "color": "#FDAE61"}
],
"links": [
{ "source": 0, "target": 1, "value": 1 },
{ "source": 0, "target": 3, "value": 2 },
{ "source": 2, "target": 1, "value": 2 },
{ "source": 2, "target": 3, "value": 1 }
]
}