Python Performance Profiling for Production
~ It's About Time ~
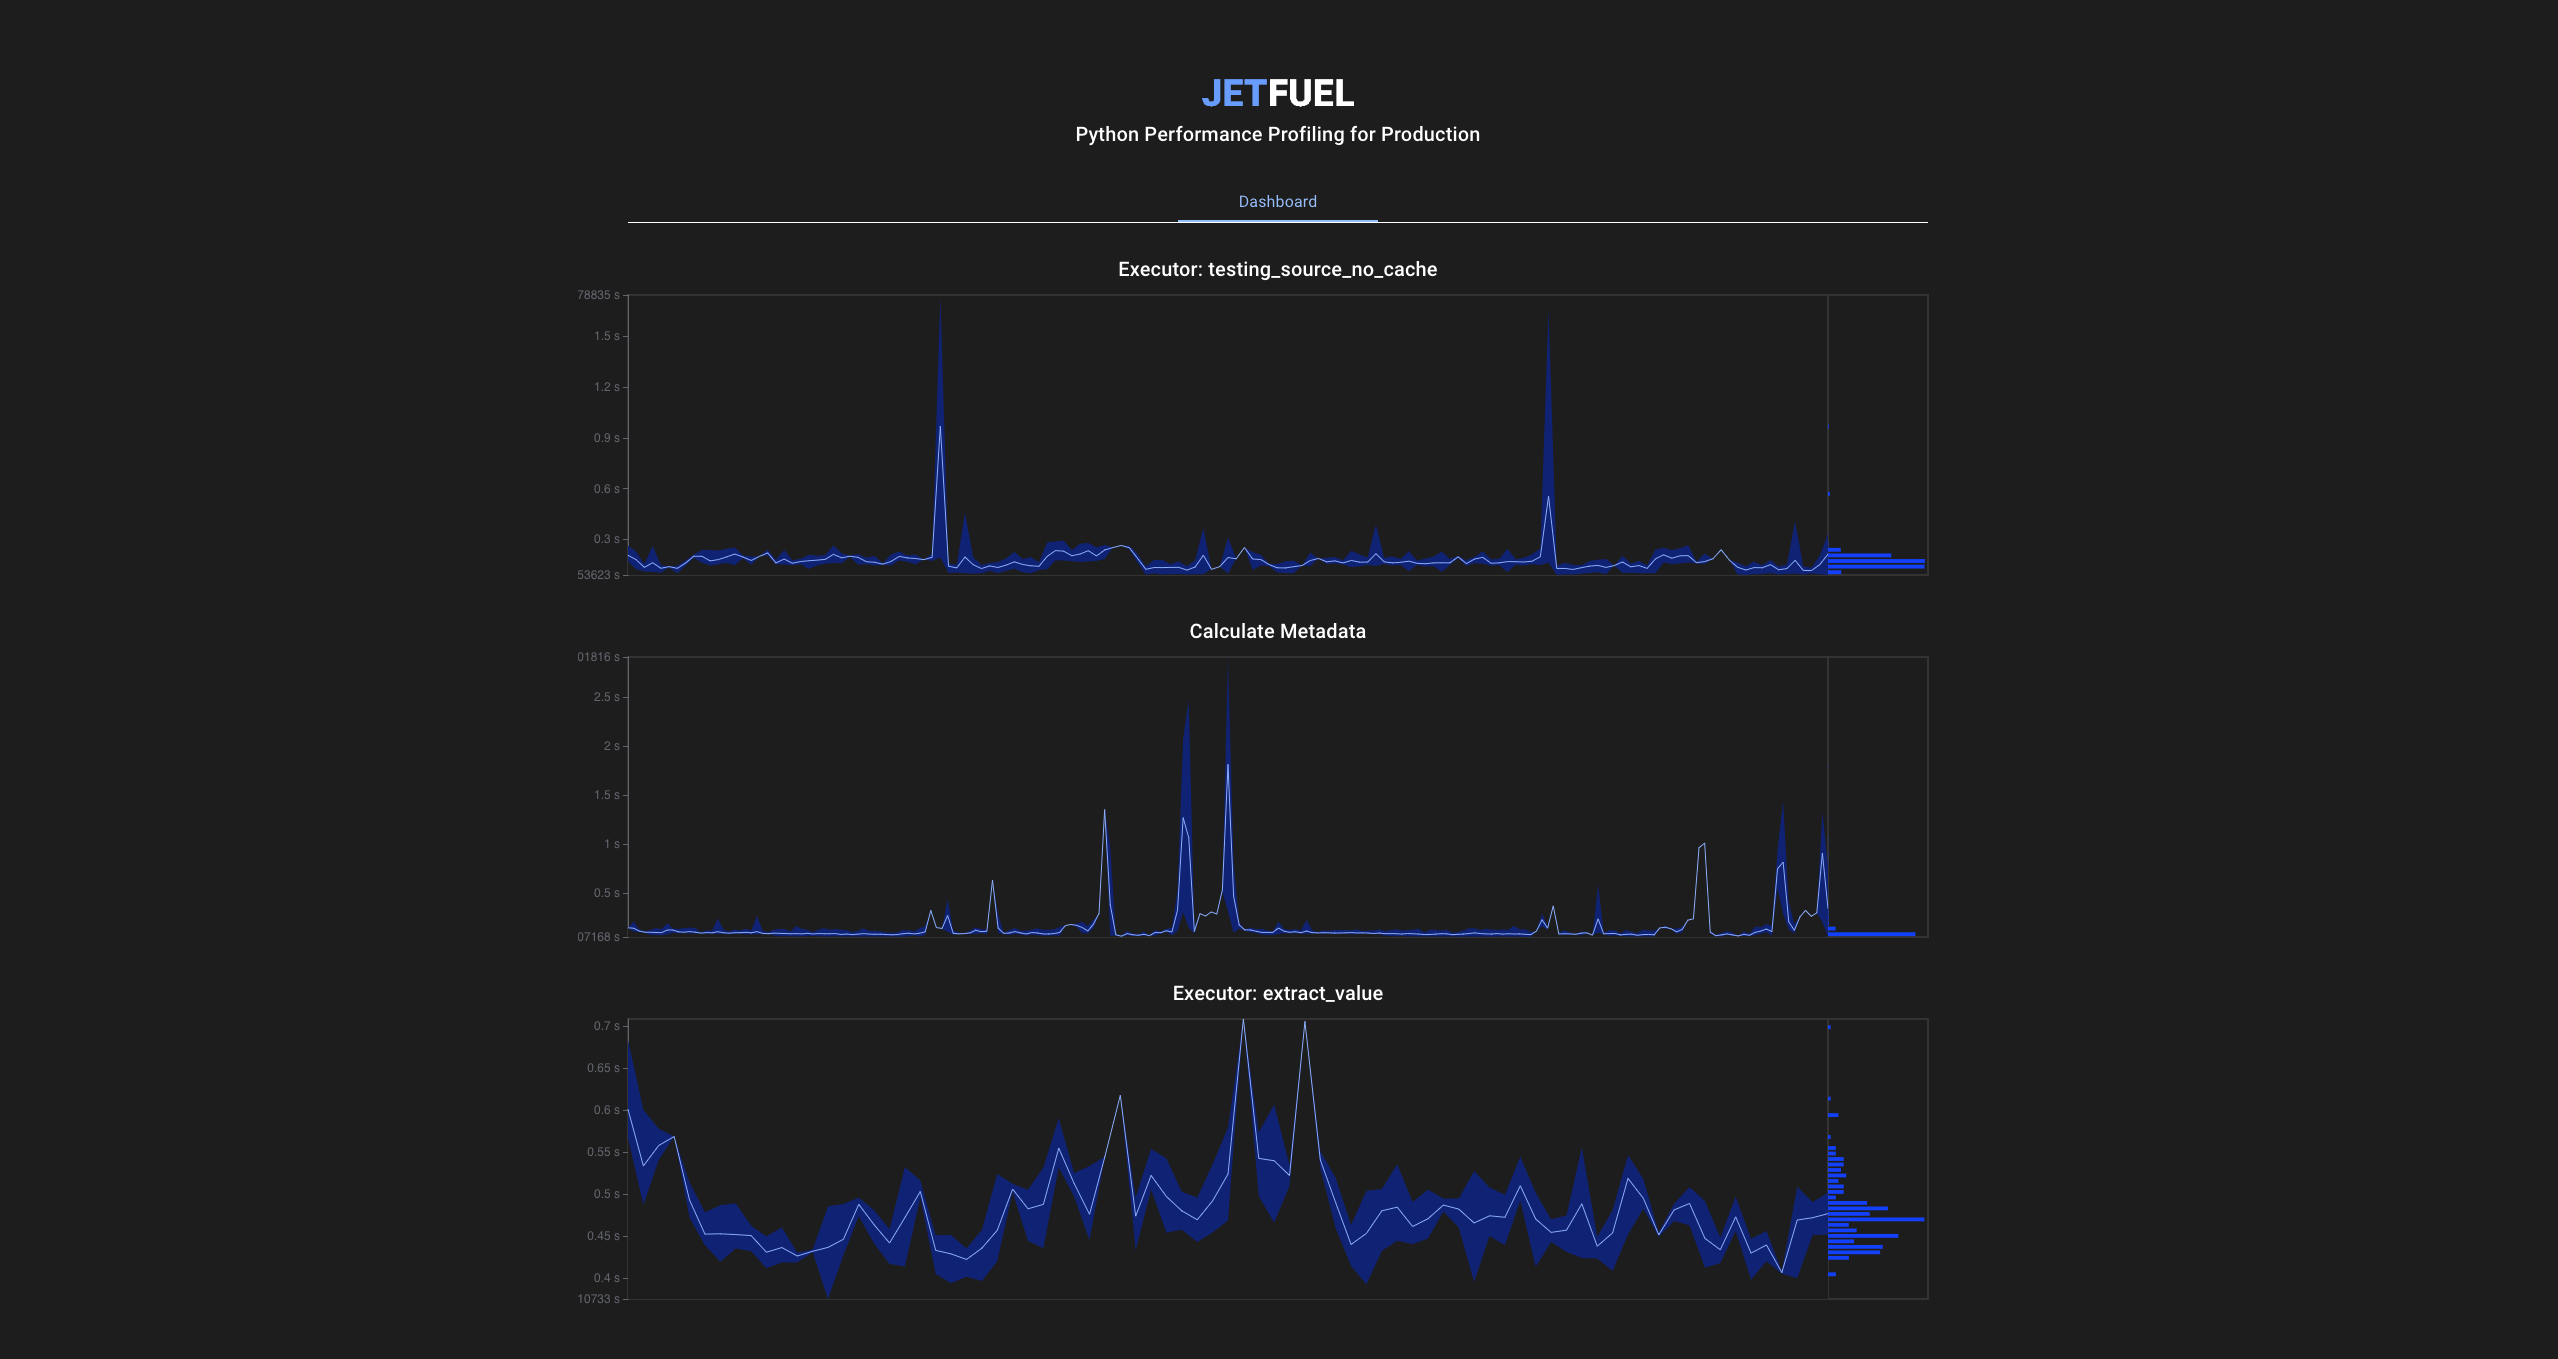
Jetfuel is a performance profiler that can monitor the performance of your production Python, and makes results easy to aggregate and search through.
Jetfuel is designed for Purposeful Profiling. This means that you only use Jetfuel around code of interest, instead of dumping all code performance logs and mining it later.
Useful for Profiling:
- 🌎 API performance
- 🚀 CI/CD stage / granular performance
- 💡 ML training & inference jobs
- 📀 Database queries
- 📊 Data pipelines / compute jobs
Bad performance has real world consequences, and is often a result of lack of visibility, even if you are logging it, if it's not be easy to get to, it will be ignored.
What gets measured gets managed!
Jetfuel is very simple. The client simply times sections of your code, and batches / aggregates them before committing to the Jetfuel server. Updates are aggregated based on a configurable resolution (default 5s). This batching / aggregating behavior allows us to time ms/ns code without introducing much overhead.
pip install jetfueldocker run -it -p 9000:9000 -v ${PWD}/data:/bin/jetfuel/data jetfuel/jetfuelimport jetfuel
jetfuel.init(url="http://localhost:9000")
jetfuel.demo()-
Start / Stop
p = jetfuel.start("Foobar")
pass
p.stop()
-
Profiler
with jetfuel.Profiler("Foobar"):
    pass
-
Function Decorator
@jetfuel.profiler("Foobar")
def ml_training():
    pass


