Time
Time domain HRV analyses are often classified as statistical or geometric methods. Statistical time-domain measures are statistical based measures calculated directly from the IBI series. Time domain measures include: mean IBI, the standard deviation of the NN interval series (SDNN), the root mean square of successive differences of the IBI series (RMSSD), the number of successive differences that are greater than x milliseconds (NNx), and the percentage of total intervals that successively differ by more than x milliseconds (pNNx) [19].
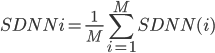
Two variants of the SDNN are used with longer datasets. The first step in both of these variations involves separating the IBI series into non-overlapping segments. For human IBI’s the segment lengths are often five minutes [4]. The first variant is the SDNN index or SDNNi, Equation (2.6) , and is computed by finding the standard deviation of each IBI segment and then returning the mean value of standard deviations. The SDANN measure is computed in the opposite manner, Equation (2.7). SDANN computes the mean IBI of each segment and then returns the standard deviation of all means. SDNNi and SDANN are represented mathematically using the following equations:
Equation (2.6)
Equation (2.7)
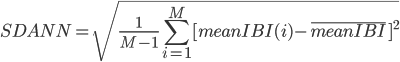
where SDNN(i) represents the SDNN value of the ith IBI segment, meanIBI(i) represent the mean IBI value of the ith IBI segment, and M is the total number of segments.
Geometric HRV measures are based on calculations taken from a geometric pattern who’s basis lies with the IBI series [4]. The most common geometric pattern used is the histogram of IBI. Two measures based on the IBI histogram are the HRV triangular index (HRVti) and the triangular interpolation of the NN interval histogram (TINN). Figure 2.3 represents the histogram of a hypothetical IBI series where D(t) is the density distribution of IBI. The maximum value of D(t) is represented by Y and is located at t=X. HRVti is the value obtained by dividing the area integral of D(t) by the maximum value Y. If the distribution D(t) is on a discrete horizontal scale then the area integral is just the total number of IBI intervals NIBI¬. Therefore HRVti is obtained by
Equation (2.8)
HRVti=NIBI/Y
For the computation of TINN the values N and M are established on the time axis and a triangular function q(t) constructed such that q(t)=0 for M ≤ t ≤ N. The peak of the triangle occurs at q(X)=Y. The triangle base defined by M and N are determined by minimizing the integral . Finally, TINN is expressed in milliseconds and computed using [4]
Equation (2.9)
TINN = M - N
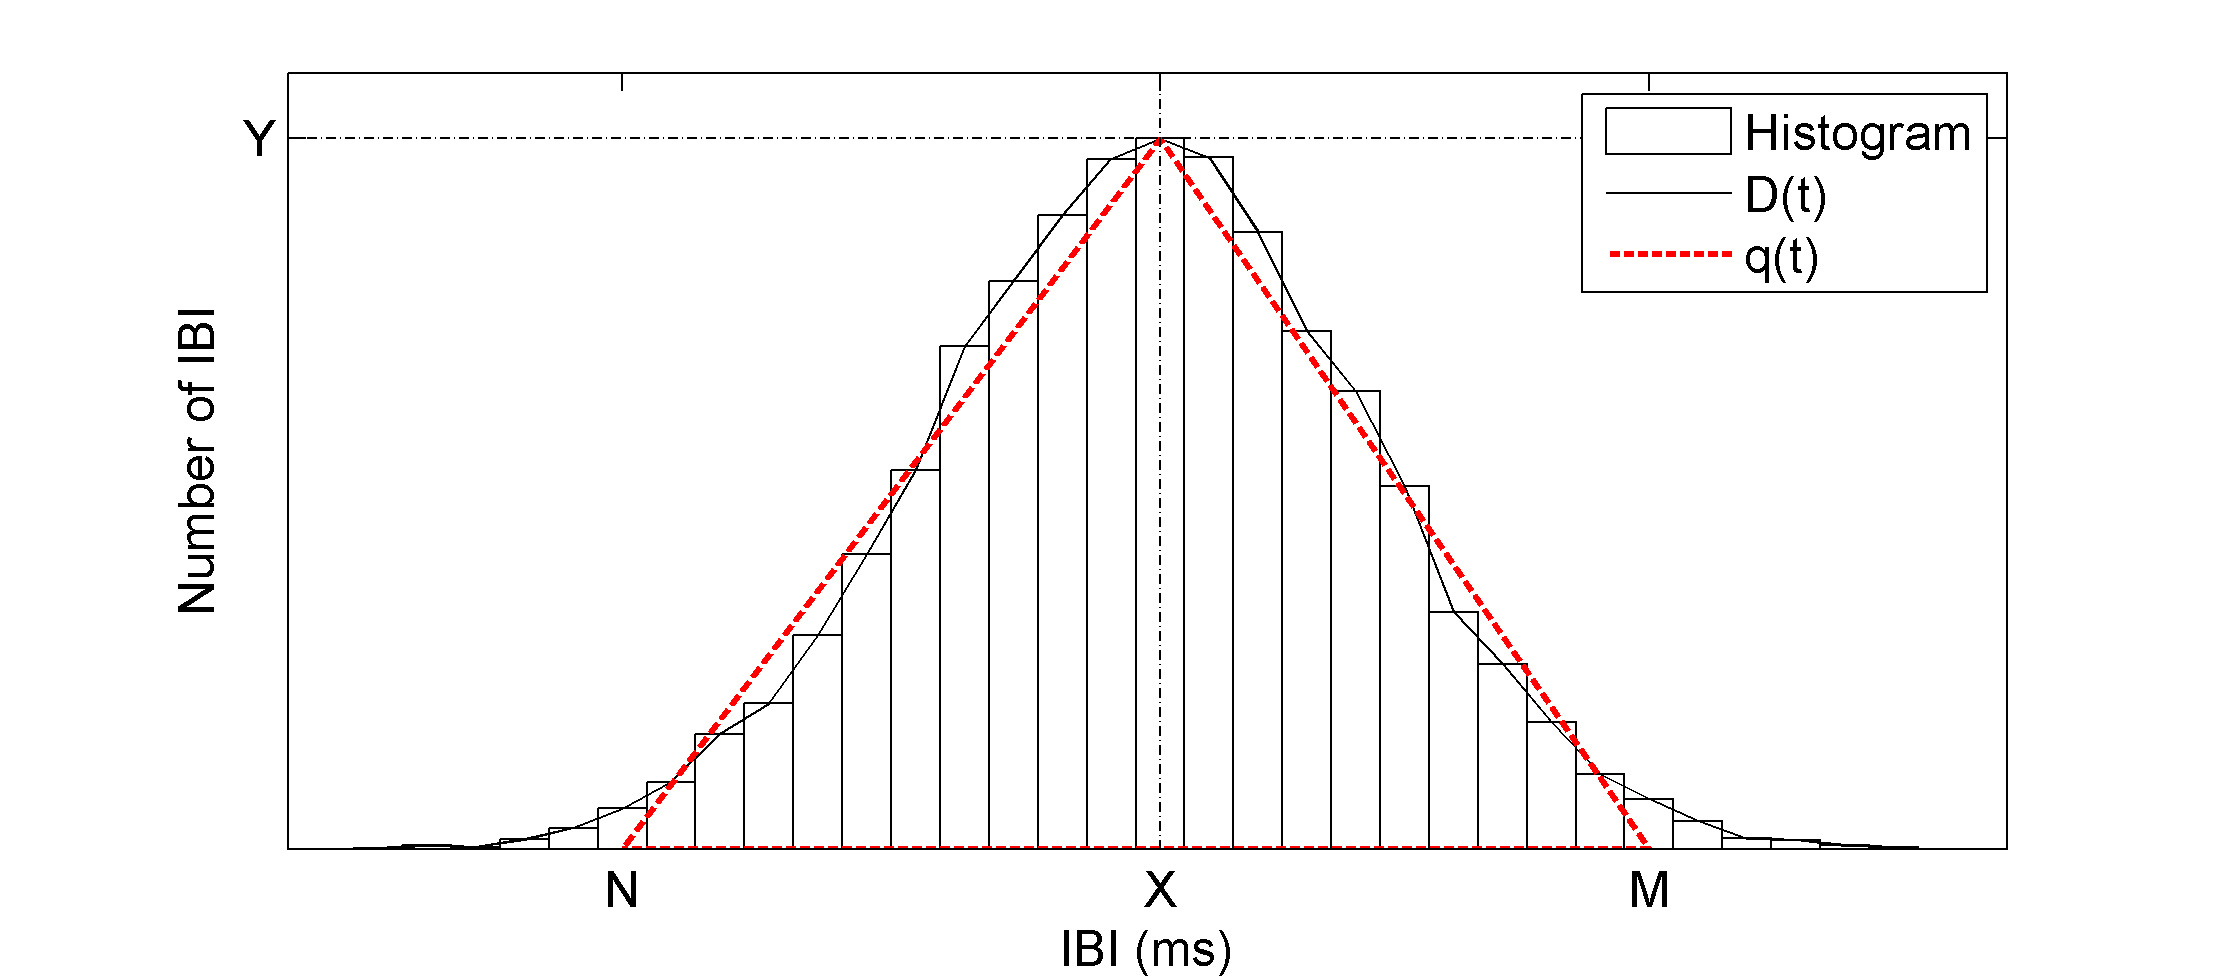
Figure 2.3 – Histogram of hypothetical IBI time series. D(t) represents the sample distribution. q(t) represents a triangular function fitted to D(t) by minimizing the integral of the squared difference between D(t) and q(t). Y = D(X) = max(D).