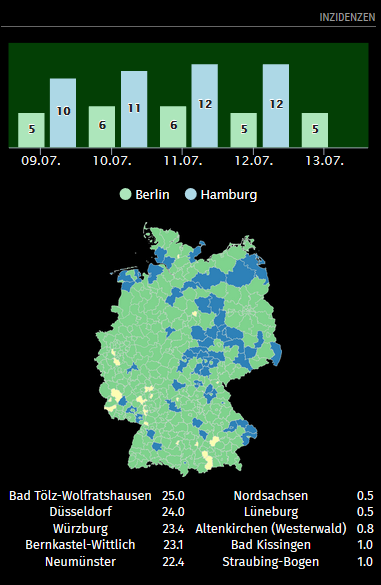
A MagicMirror module showing last days COVID19 incidence rates.
Uses data from RKI.
Only available for Germany
- Navigate into your MagicMirror's
modulesfolder and executegit clone https://github.com/lavolp3/MMM-COVID19-Inc.git. - Navigate into the module folder and install npm dependencies:
cd MMM-COVID19-Inc && npm install - Add the module in
config.jsplacing it where you prefer.
{
    module: "MMM-COVID19-Inc",
    position: "top_right",   // see mirror settings for options
    header: "Inzidenzen",
    config: {
        width: 400,
        days: 7,
        districts: ['Berlin', 'Hamburg'],
        chartType: "line",  //use "line" or "bar"
        showGraph: true,
        showMap: true,
        showRanks: true,
        ranks: 5,
    },
},
| Option | Description |
|---|---|
chartType |
Type of chart Type: stringValues: 'line', 'bar' Default: "line" |
width |
Width of the graph Type: IntegerDefault: 400 |
chartHeight |
Height of the chart Type: IntegerDefault: 300 |
days |
Number of days to show Type: IntegerDefault: 7 |
districts |
Array with districts to show (see below!) Type: arrayValues: ['region1', 'region2', ...]Default: ['Berlin', 'Hamburg'] |
showYAxis |
Show Y-Axis of chart Type: boolean Default: false |
showGraph |
Show graph of seleced regions Type: booleanDefault: true |
showMap |
Show heatmap of Germany Type: booleanDefault: true |
mapWidth |
Control the maps width/height with this Type: integerDefault: 250 |
showRanks |
Show ranks of Regions with highest/lowest Incidence rates Type: booleanDefault: true |
ranks |
Number of entries with highest/lowest Incidence Type: integerDefault: 5 |
debug |
Debug mode (increased console output) Type: booleanDefault: false |
You can have the module search for districts (Landkreise) by just including the name of the district.
If it doesn't show on the graph, you probably haven't used the proper name of the district.
E.g. "Wesel" will work (Kreis Wesel). "Moers" will not (part of "Kreis Wesel").
Data provided by api.corona-zahlen.org, provided by Marlon Lückert
Thanks Marlon!