DebugTools is a PowerShell based toolkit for debugging and reverse engineering .NET programs.
The following outlines some of the major capabilities of DebugTools
Have you ever looked at a .NET application and asked yourself
- What does this button do?
- Why isn't something appearing in my search results?
- How does this work?
- Which file is the code for this in?
Answering such questions can often turn into hours long ordeals, slowly stepping in and around the target application using a debugger such as dnSpy. You don't know exactly what you're looking for, but you'll know it when you see it. Wouldn't it be nice though if, instead of manually stepping through the program, you could just record every single thing the program did, and then poke at this recording to get the data that you need?
This is exactly what the DebugTools Profiler does. Except where otherwise stated, all cmdlets provided by DebugTools should work with both .NET Framework and .NET Core.
Suppose you want to understand what the gci command does in PowerShell.
First, we'll launch a new instance of PowerShell, and specify that we want to perform detailed tracing of method parameters/return values
# Original PowerShell Prompt
C:\> Start-DbgProfiler powershell -Detailed
We don't enable tracing method calls on the target process until it's fully initialized. This allows the target process to not only startup faster, but also reduces the amount of noise we'll need to cut through when we get to the analysis stage.
Once the target process has fully initialized, we begin tracing the target process
# Original PowerShell Prompt
C:\> Trace-DbgProfilerStack
In the target process, execute the gci command
# Target PowerShell Prompt
C:\> gci
When the results of the gci command have finished outputting, switch back to the original PowerShell prompt and hit Ctrl+C to stop recording
# Original PowerShell Prompt
Ctrl+C
The root frames of all threads will be emitted to the pipeline. Each Profiler Session that you start automatically caches its last recorded trace. If a trace is not explicitly specified to an analysis cmdlet, the last recorded trace will implicitly be used.
We can assume that the "gci" command we executed was passed as a string to a variety of methods in order to translate it into an actual command. We can immediately view the unique call stacks of all methods that the value gci was passed into by maximizing our original PowerShell window and then using the following command
# Show the call stacks of any methods where the value "gci" was passed in (either as a raw string or
# a sub-member). Only show the first invocation of each method, and exclude namespace gunk from the
# resulting output (Tip: you can also specify parameter -Simple which implies -Unique -ExcludeNamespace)
C:\> Show-DbgProfilerStackTrace -StringValue gci -Unique -ExcludeNamespace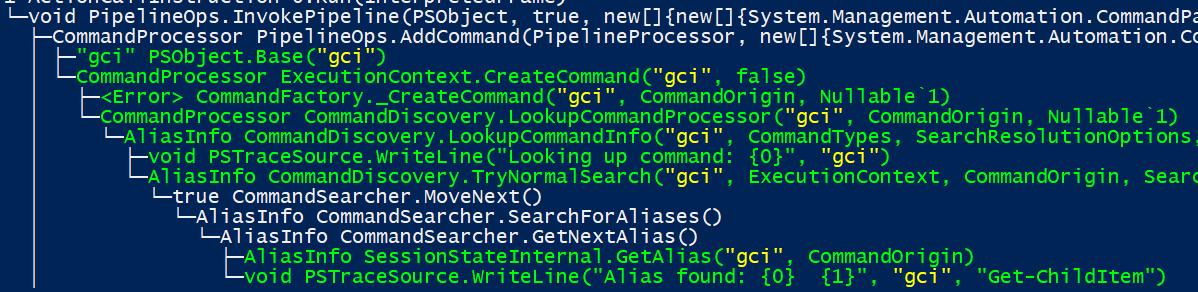
Amongst the returned output, we spot an interesting sequence of events: inside of InvokePipeline, AddCommand tries to discover what the command gci command is. As part of TryNormalSearch it considers the possibility that gci might be an alias. And then sure enough, it resolves the alias gci to Get-ChildItem.
It seems reasonable to assume that after the AddCommand method finished, the parent InvokePipeline method invoked some other sequence of methods,
ultimately leading to the Get-ChildItem being invoked. While we could dump all of the frames called from InvokePipeline and eyeball the output (which could be quite a bit) for methods that look relevant, given we know the command Get-ChildItem is being invoked, let's filter for any frames containing the wildcard expression *childitem*.
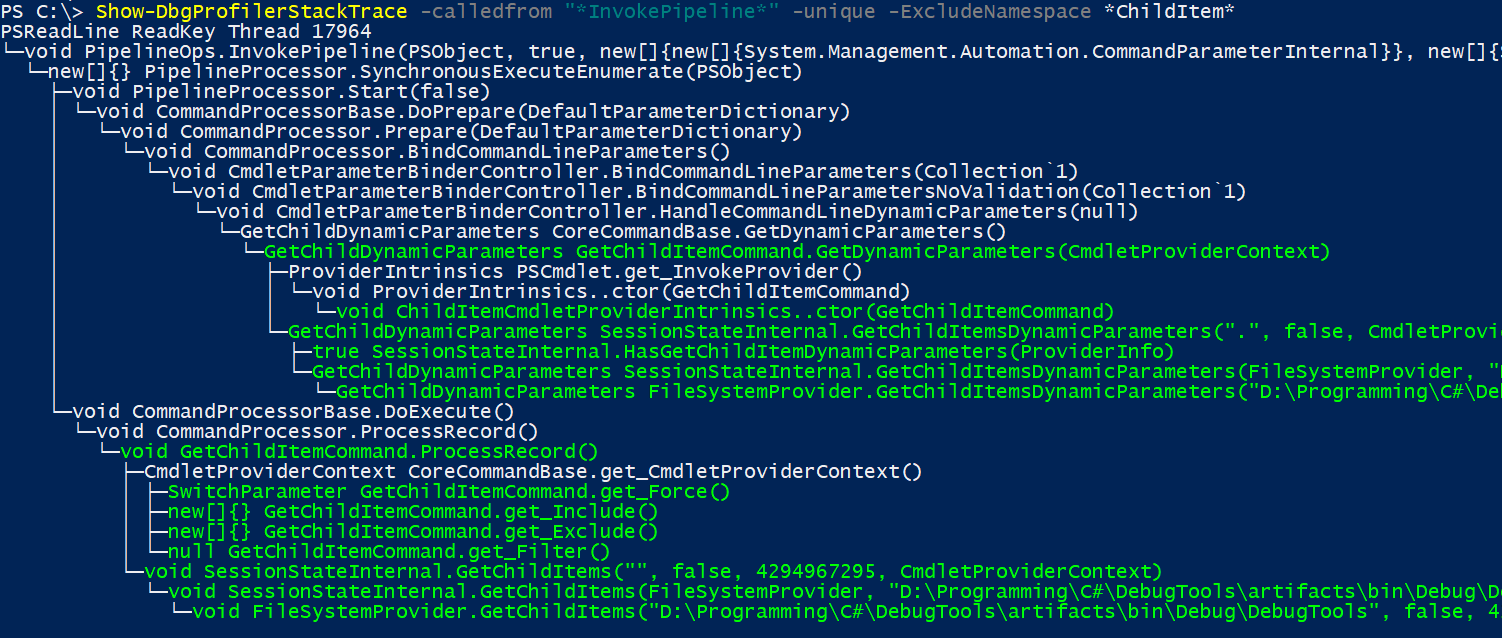
From this, we can clearly see that the implementation of Get-ChildItem is a class aptly named GetChildItemCommand. To find which module this type is defined in, we can use the Get-DbgProfilerMethod command.
C:\> Get-DbgProfilerMethod -TypeName *GetChildItem*Things you can do with the DebugTools Profiler
- Record all frame transitions that occur during process startup, or within a given window after the process has fully initialized
- Capture values passed to and from functions, including class/struct members a customizable number of levels deep
- Output, in real time, frames that occur that match a complex set of search criteria
- Enumerate all methods that were invoked in the last trace, or since process startup
- Search for frames in the last trace session that match a variety of complex conditions
- Visualize a stack trace as a tree, excluding duplicate frames and highlighting frames that match certain conditions
- List exceptions that occurred in the process, including where they were both thrown and handled from
- Blacklist or whitelist assemblies to reduce the amount of noise you have to dig through
Note: DebugTools Profiler does not currently support multiple appdomains. To what extent the profiler can be used against an application utilizing multiple appdomains is untested and unknown.
For more information on using the DebugTools Profiler, please see the wiki.
Typically, in order to do low level analytics of .NET programs you need to attach to the target process using WinDbg, load SOS and then run a command to extract the data you need. DebugTools contains a collection of cmdlets that perform some of the same key queries, using the underlying ISOSDacInterface API against running processes.
Actions you can perform using DebugTools' SOS cmdlets include
- Enumerate AppDomains, Assemblies, Modules, MethodTables, MethodDescs and FieldDescs
- Show a live stack trace (will pause and then resume the target process)
For more information please see the wiki.
When attempting to reverse engineer programs that make heavy use of COM (e.g. Visual Studio), you can easily find yourself trying to figure out the native type a given interface is implemented in so you can poke at it further using a program such as IDA Pro. This process can often be laborious and involve a large amount of trial and error.
Suppose you want to know the native type that implements the IVsSolution interface within Visual Studio.
First, we a establish a connection to the target process
C:\> Connect-SOSProcess 75042And then enumerate all objects that implement an interface whose name contains "solution" in it
C:\> Get-ComObject *solution*Note: due to issues encountered using newer versions of ClrMD, this feature currently uses an older version of ClrMD, and as such may or may not support newer .NET Core runtime versions.
Trying to reverse something, and need to know what types/assemblies implement a specific interface? The Get-ClrType cmdlet can help you out!
# Get all types that implement the IServiceProvider interface that contain "Ole" in their names
Get-ClrType "C:\Program Files (x86)\Microsoft Visual Studio\2019" -Interface IServiceProvider -Name *Ole*