-
Notifications
You must be signed in to change notification settings - Fork 57
New issue
Have a question about this project? Sign up for a free GitHub account to open an issue and contact its maintainers and the community.
By clicking “Sign up for GitHub”, you agree to our terms of service and privacy statement. We’ll occasionally send you account related emails.
Already on GitHub? Sign in to your account
Show the fps history up to 3000 frames in the README #26
Conversation
* The first 180 frames tell a partial story: they would last only
  3 seconds at 60 FPS while an actual game will run far longer.
|
@mame Thoughts on this? |
|
@mame Gentle ping. |
|
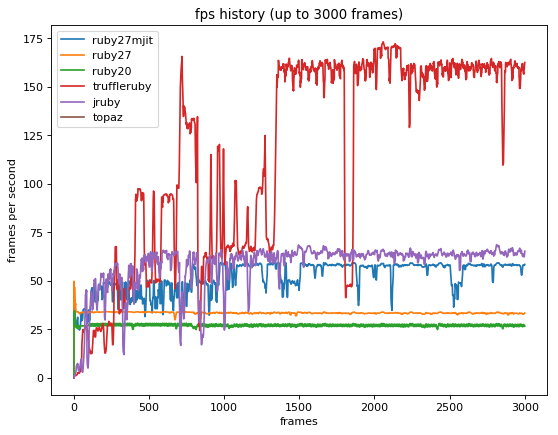
Actually on the current warmup chart, we can also see that the MJIT numbers from the README are misleading (the README says 48.6FPS but it reaches ~60FPS), and that MJIT clearly also needs more than 180 frames to reach peak performance: So all implementations with a JIT need more than 180 frames of warmup. This is part of the trade-off, and I believe it should be shown right in the README, and not just the arbitrary limit of 180 frames which only shows a (very) small part of the results. @mame Could you merge this PR? |
|
Sorry for leaving this ticket, but honestly, I'm still reluctant to make the top README messy.. I'd like to put a simple chart that just answers "how fast they are, in short". I know that the chart does not reflect the peak performance of Ruby implementations including MJIT, but fast warm-up is actually very important for optcarrot because many games start their opening title in 180 frames from the boot. If 60 fps is not achieved at this time, the game screen is laggy and the music is noisy. I believe "180 frames" is a reasonable criteria for optcarrot, and the current chart shows one certain aspect of the "net" performance of Ruby implementations. That being said, I admit that optcarrot is now handled as a somewhat influential benchmark program for Ruby, and I'd like to respect Ruby JIT implementors. @k0kubun, do you have any opinion? I'll ask matz's opinion, too. |
|
I chatted with matz and akr-san, and matz suggested adding a new histogram at frame 3000 instead of the fps history chart. I think that it is better than showing two different-type charts, so I'll do it. Akr-san said that the caption of the chart, "Ruby implementation benchmark with Optcarrot (180 frames)", is not easy to understand. He suggested "(three seconds in the emulation time)" or something, but I have no idea about good wording. Do you have any idea? |
Sounds good to me :) Luckily it seems the performance is mostly stable around frame 3000.
I think the current title is fairly clear. I think "(three seconds in the emulation time)" would be confusing. If you want something shorter I'd suggest "Optcarrot, first 180 frames".
|
I'm interested in the comparison of peek time performance, so I'm +1 for including a graph which shows that. Though I don't have a strong preference on its details. As long as the fps at 3000 frames can show the peak performance of every implementation on @mame's environment, I'm fine with the current proposal #26 (comment).
I like this. TBH I didn't know it's currently showing 171-180, and that makes it clear. |
|
Yes, it is intended. And I also removed the startup-time plot. I agree they were all useful, but they made the tool programs (like run-benchmark.rb and plot.rb) harder to maintain and the benchmark process painful for me. Unlike a paper, I need to update the benchmark at least per year, so I want them to be simpler. |

3 seconds at 60 FPS while an actual game will run far longer.
I think many/most people will only see the README and miss the benchmark.md link or not click it.
Also benchmark.md contains a lot more information, which seems not so relevant for most readers.
Since OptCarrot is principally a benchmark I think it makes total sense to show the most relevant charts directly in the README.