Axes instantiation is very slow #6664
Comments
|
Any help improving the performance would be greatly appreciated! It is a bit odd that the In the orginal implementation of stale the the propagation was short circuited, but that lead to the figure auto-refresh getting stuck. |
|
Here is the test and profiler diagram import timeit
timeit.timeit(
"Axes(fig, (0, 0, 1 ,1))"
,
"from matplotlib.figure import Figure;" \
"from matplotlib.axes import Axes;" \
"fig = Figure();"
,
number=20
)
|

|
How did you generate that profiler diagram? |
|
It is generated in PyCharm IDE which uses yFiles and yappi |
|
The bottleneck is After commenting it out I have got only 2 ms instead of 33 ms per Axes instantiation 100 loops, best of 3: 2.41 msec per loopCall graph becomes much simpler too |

|
I think (matplotlib 2.0b1) |
|
Wow... that is a very informative graph. There seems to be several On Tue, Jun 28, 2016 at 6:45 PM, Antony Lee notifications@github.com
|
|
Every possible grid and tick line is being instantiated; in practice, most of them don't get used. Lazy instantiation would solve that, at the cost of a little more complexity. |
|
On newly created axis we do not even have ticks, but here we have creation of single tick for the internal purposes. This should not be problem, but it is, because for single I have tried to figure out if it is possible to simplify As this optimization will affect multiple places and include rewriting of |

It seems like using such changes to get a performance boost is still worth it, even if it's not the best solution. After all, these changes were proposed about 10 months ago, so that's 10 months where things could have been faster... @efiring would you be okay with such a workaround in the meantime until lazy instantiation can be implemented? |
|
@Kojoley, any more thoughts on this? Or did you run into a roadblock? |
We don't need any Spines since GeoAxes uses its own outline_patch to
draw the outline. We also don't need any Axis drawing, so override its
generation of a "proto-Tick". This is expensive [1] and it's not used to
draw any ticks anyway.

[1] matplotlib/matplotlib#6664
|
Somehow, diff --git a/lib/matplotlib/axis.py b/lib/matplotlib/axis.py
index 870c5e8..307b425 100644
--- a/lib/matplotlib/axis.py
+++ b/lib/matplotlib/axis.py
@@ -764,10 +764,8 @@ class Axis(artist.Artist):
del self.majorTicks[:]
del self.minorTicks[:]
- self.majorTicks.extend([self._get_tick(major=True)])
- self.minorTicks.extend([self._get_tick(major=False)])
- self._lastNumMajorTicks = 1
- self._lastNumMinorTicks = 1
+ self._lastNumMajorTicks = 0
+ self._lastNumMinorTicks = 0
def set_tick_params(self, which='major', reset=False, **kw):
"""then the first test that fails looks like this: |

|
What is the status here? I need to create plots with some tenths of axes and this issue results in instatiation times of seconds, which is a pain in interactive gui applications. If there are some problems with the above solutions, one could use a If there is interest, I can provide a pull request. |
|
We have two overlapping PRs, #8626 and #8752, that will improve the situation quite a bit by eliminating most of the unnecessary We would certainly be interested to see a PR with your proposal as well, which is orthogonal to the cla-elimination PRs so it should provide additional speedup in cases where ticks are not used at all. |
|
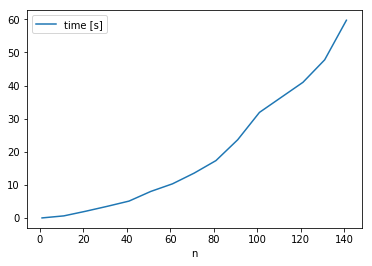
I have run into the same problem with 384 subplots. Solved it with this hack (thanks @tacaswell ). Got down from 20 minutes to 2 seconds. Not sure if it helps anybody but I have measured that the time to produce figure grows exponentially(!) with the number of subplots.
|

|
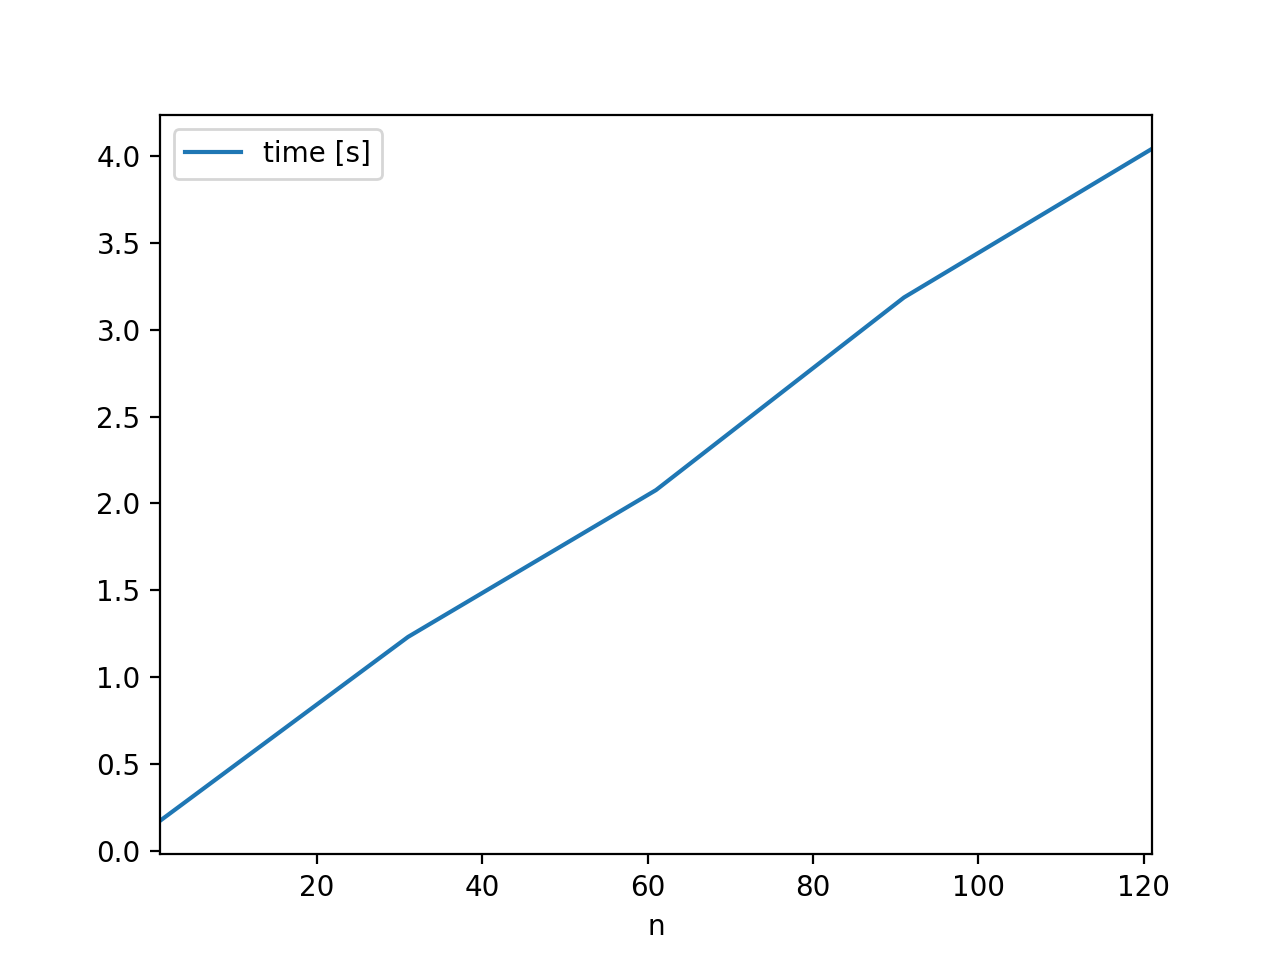
I'm seeing linear, not exponential, growth in the time to create multiple subplots (with mpl very close to current master): |
|
@michalkahle, can you provide a minimal and self-contained test case that reproduces something like your curve? |
|
2.0.2: In 2.1.1 master is the same as 2.1.1 for this test... My guess would be that @michalkahle is using 2.0.2? |
|
Hi, my mpl is 2.1.0. import pandas as pd
import matplotlib as mpl
import matplotlib.pyplot as plt
import numpy as np
from time import time
s = pd.Series(np.random.randn(10).cumsum(), index=np.arange(0, 10))
def test_grid(n, s):
nrows = int(math.sqrt(n))
ncols = math.ceil(n / nrows)
fig, ax = plt.subplots(
nrows=nrows, ncols=ncols, figsize=(24, 16), sharex=True, sharey=True, squeeze=False)
for a in range(n):
row, col = divmod(a, ncols)
s.plot(ax=ax[row,col])
plt.close()
results = []
for n in range(1, 150, 10):
print(n)
start = time()
test_grid(n, s)
results.append((n, time() - start))
pd.DataFrame(results, columns=['n', 'time [s]']).set_index('n').plot()
|
|
Its the
|
|
It's not so much the sharing, it's the way Pandas is handling the sharing. Removing Pandas and leaving the sharing speeds it up greatly. Removing the sharing speeds it up even more. import matplotlib.pyplot as plt
import numpy as np
from time import time
def test_grid(n, share):
start = time()
nrows = int(np.sqrt(n))
ncols = int(np.ceil(n / nrows))
kw = dict(sharex=True, sharey=True) if share else {}
fig, ax = plt.subplots(
nrows=nrows, ncols=ncols, figsize=(24, 16), squeeze=False, **kw)
for i in range(nrows):
for j in range(ncols):
ax[i, j].plot([1,2,3])
plt.close()
return nrows * ncols, time() - start
nums = list(range(1, 151, 10))
times = np.zeros((len(nums), 2), dtype=float)
naxes = np.zeros((len(nums),), dtype=int)
for i, share in enumerate((True, False)):
for j, n in enumerate(nums):
na, duration = test_grid(n, share)
times[j, i] = duration
naxes[j] = na
print("%5s %3d %7.2f" % (share, na, duration))
fig, ax = plt.subplots()
lines = ax.plot(naxes, times)
ax.set_ylabel('time (s)')
ax.set_xlabel('number of Axes')
ax.legend(lines, ['shared', 'unshared'])
fig.savefig('many_axes_plain.png') |

|
Yes, you are right. array = np.random.randn(10).cumsum()
series = pd.Series(array)
def test_subplots(n, data):
start = time()
fig, ax = plt.subplots(nrows=1, ncols=n, sharex=True, sharey=True, squeeze=False)
for i in range(n):
if type(data) is pd.core.series.Series:
data.plot(ax=ax[0,i])
else:
ax[0,i].plot(data)
plt.close()
return n, time() - start |

|
So #8626 was applied and then reverted due to some issues with polar stuff. For 1-, 2-, and 10-square subplots, timings are 118.42ms, 374.95ms, and 3.91s, respectively. In the meantime, #10302 was merged, which drops time to 79.00ms, 284.09ms, and 2.90s, respectively. You can see that change in the benchmarks. If we re-apply #8626, we could perhaps save another 2-4% at 77.03ms, 268.03ms, and 2.77s. But unfortunately, it's still breaking polar plots somehow. |
|
What is the status with this? I'm using matplotlib in a Jupyter notebook and it seems that |
|
We have a speedup of a factor 4 by lazily instantiating ticks ( #9727 / #10302 ). However, the essential problems still persist. One is the tick handling, which handles each tick as a separate object. The second is the layered architecture and initialization / update mechanism. Both are hard to change. |
|
There is certainly more work to do on this, but it is usually not a noticeable when working interactively unless you are making a plot with a large number of axes. Is this your use case, @TomNicholas? If not, I wonder whether you might be running into some other problem. |
Another place where this might have a significant impact is animations / interactive plot updates. Blitting is a workaround, but a user perspective it's sometimes easier to just redraw everything in which case axis instantiation time will be non-negligible. |
|
I'm finding the same slow behavior when doing a bunch of imshow in a figure in jupyter and I don't know if the issue belongs here or to jupyter. Something like this simple takes almost 18 s in my computer. The larger the image, the longer it takes: |
The original issue is about axes creation, redrawing is a different problem. There is RGBA<->BGRA conversion which takes a considerable amount of time if you make hundreds redraws per second. (I have a patch to make it faster but it actually three patches for every of GCC, Clang, and MSVC compilers because their optimizers and vectorizers are too far from being good).
I tried your code and it takes 600ms for me. |
|
@aasensio which matplotlib version? Also please time with and to see the which fraction of the time is covered by the subplot creation. |
|
@timhoffm My version of matplotlib is 3.0.2, running with notebook server 5.7.4. The timing results are 684 ms for the subplots creation only and 12.7 s when the imshows are added. I'm starting to suspect that it is somehow related to the server-client I/O in my system, which might be firewalled. I'll investigate on that. |
|
I think the original issue is solved now - at least for me the performance bottlnecks mentioned at the top are not present in the currently |
|
I would not say it is solved, but the situation is indeed improved, from 'very slow' it became just 'slow'. The #6664 (comment) implied that there could be 13-14x improvement, the #10302 gave 3-4x, so there still should be some bottlenecks. Also there were performance regressions since 2.2.5 totaling in 1.6x slowdown:
|

|
@Kojoley i think the point here is that it's pretty hard to track this in a really old issue. For sure, if we think there are current bottlenecks that could be fixed we should fix them. |
I have discovered that my application spends a lot of time in Axes creation. Results of class instantiation profiling is below:
Inside
Axes.__init__most of the execution time takesself.cla()call and about the half of it isthis loop below
After commenting this two lines I have got this:
So we have 33 ms per axes creation, and the half of this time it is used for spines creation that actually may be not used (in my case I have bunch of sharex axes and only one of them have spines).
I see a possible solution where creation of spines, scales (you can see creation of logarithmic scale, which I do not use too) and other stuff is delayed to the point when it actually needed/initialized.
And the fun part. For 20 created Axes we have 60115 calls to

Rectangle.stale(3005 call per Axes instantiation)The text was updated successfully, but these errors were encountered: