Troubleshooting
Troubleshooting MIMWAL workflows is easy! Majority of the issues can be identified just by looking at the Request Status Details (Request Workflow Remarks) of the failed request from MIM Portal or error events logged in the event log. If that does not help, then the next level of troubleshooting is to turn on tracing to track down issues.
The first resolution step for any request failure is to inspect the request resource.
To find the status of the request:
- Find the request in Search Requests.
- Open the request resource.
- On the General tab, review the Request Workflow Remarks
- On the Detailed Content tab, review the actual requested changes.
- On the Applied Policy tab, review the policies applied, so that you can find which workflow is the likely suspect.
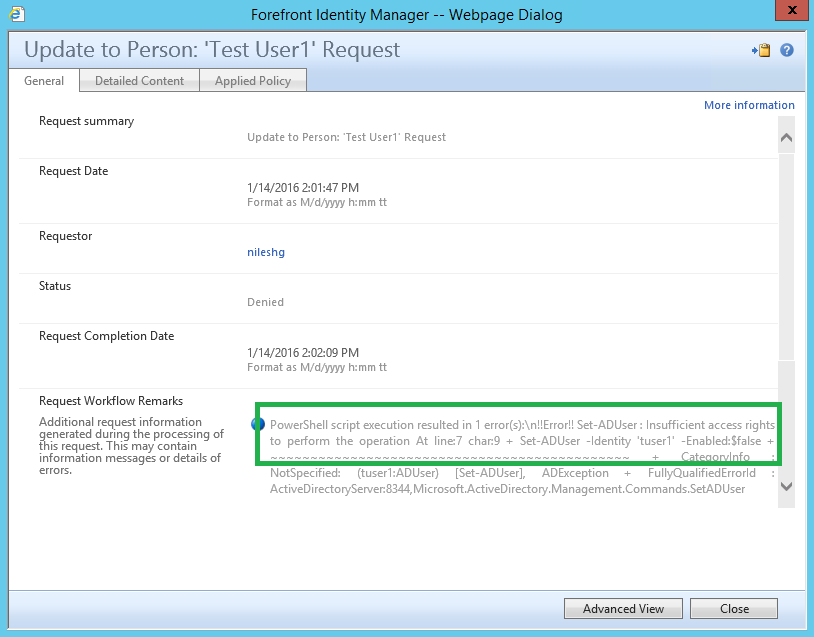
If the request is actually failing (as opposed to not failing but also not doing what it is supposed to do), it is easiest to troubleshoot. The screenshots below is an example of a request failing.
The first screenshot below shows why the request is failing and in this case due to insufficient rights to disable user "tuser1".
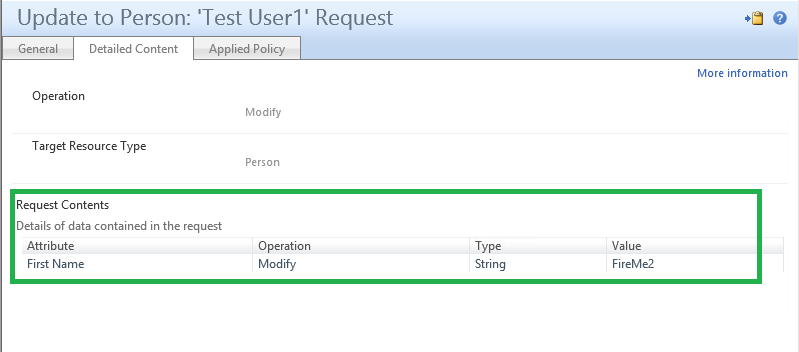
The second screenshot shows what request was submitted.
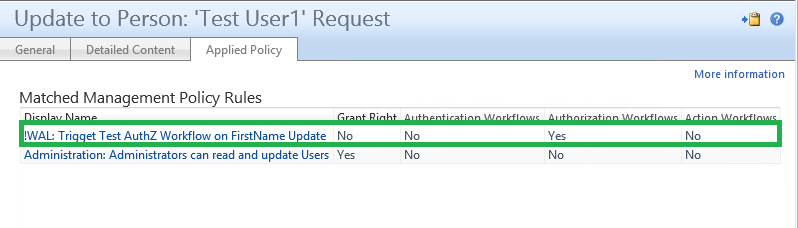
And finally, the last screenshot shows which policies were applied and from that link you can know which workflow was triggered.
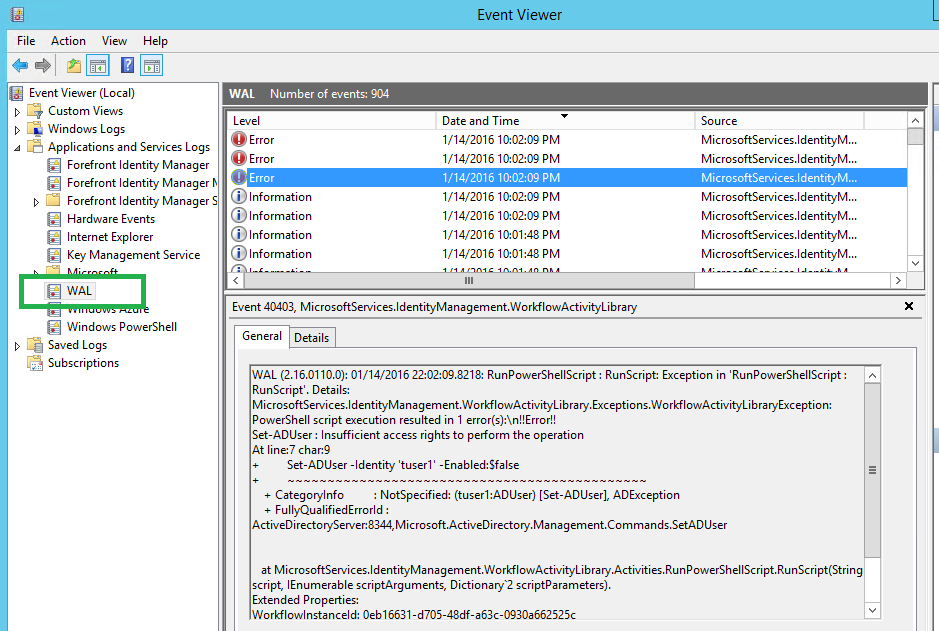
The errors that you see in the Request Status Details also get logged in the event log. While most errors will get logged in the "WAL" event log, those that are thrown by native MIM activities or due to unhandled exceptions in the MIMWAL code may get logged only in the "Forefront Identity Manager" event log. Both these event logs are located under "Application and Services Log" as shown in the screenshot below.
This troubleshooting step will be needed when the request is not failing but it is also not doing what it is supposed to do and the request history in the MIM Portal did not provide any meaningful clues.
Since MIMWAL supports ETW, you have two choices. Enable diagnostic tracing at verbose level to log events in the event log or to capture an ETW trace. The former choice - logging to event log - is typically employed during development while the later choice - ETW Tracing - typically in the UAT / production environments. You may also want to capture ETW Trace for sending it to someone on the development team to troubleshoot errors due to any unhandled exceptions.
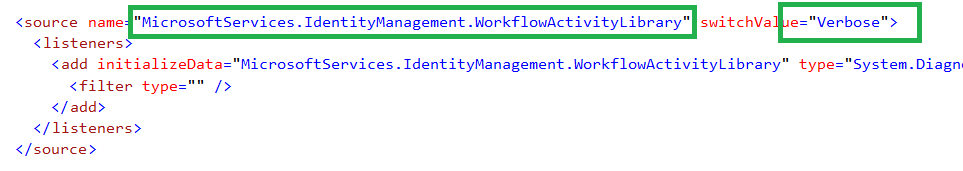
When you run Register.ps1 script to deploy MIMWAL on a server for the first time, it configures the MIMWAL event log tracing at Warning level. While the logging should be left at this trace level in a production environment, it may be a good idea to set it to Verbose trace level in a development environment immediately after the deployment to save time on making the change, restarting the service and resubmitting the request. To enable diagnostic tracing, open Microsoft.ResourceManagement.Service.exe.config file located in FIM / MIM Service Install Directory in Notepad or any other text editor and find the diagnostics source configuration for "MicrosoftServices.IdentityManagement.WorkflowActivityLibrary" and change the switchValue to Verbose as depicted in the screenshot below.
After you make changes to the Microsoft.ResourceManagement.Service.config.exe file, save the file and restart the FIM service.
Important: On a production server, the tracing should be left at the Warning level to avoid any adverse impact on system performance.
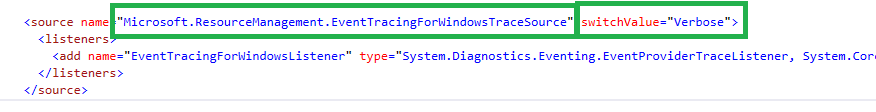
ETW tracing capabilities of MIMWAL piggy-backs on the ETW tracing subsystem of FIMService. When you collect ETW traces for FIMService, it will collect it for MIMWAL activities as well providing a single holistic view of the internal workings of FIMService. ETW tracing at verbose trace level is enabled by default for FIMService and hence for MIMWAL as depicted in the screenshot below:
Important: For ongoing production operation, it is recommended that you turn off ETW tracing post deployment and turn it on only when there is a need to troubleshoot MIM / FIM Workflow issues. You'll need to restart FIMService for the changes to take effect.
To capture ETW trace:
- Make sure that the "switchValue" for the ETW diagnostic source is set to "Verbose" as depicted in the previous screenshot. If you needed to modify the existing value to make it "Verbose", restart FIMService.
- Copy
CaptureTrace.cmdfrom the MIMWALSolutionOutputon the server in a folder where you want the logs to get saved e.g.C:\Tempand run it with administrative privileges. Leave the console window up and running. - Switch to the MIM Portal, repeat the task and submit the request that you want to troubleshoot.
- Search the submitted request in Request History section of the MIM Portal and make sure that the request processing is complete.
- Switch back to the console window and press any key to stop the trace.
- Press any key again to exit the window.
The formatted results of the traced are saved in the same folder and event log file name named FIMTrace is the file that will be of most interest for troubleshooting.
Note: The event log file produced by ETW Tracing does not display any messages on the General tab of the event. To see the messages, you need to click on the Details tab and switch to XML View.
Both the previous methods of tracing that is logging into the event log or capturing ETW trace, give you an event log that you can open and analyse. The Verbose mode of logging is really really chatty and will produce tons of event entries. But no worries, there's a Find button for that!. To find what value was returned by a particular lookup or function expression or search filter in a WAL activity, just search for that expression or string to narrow down the list of events.
This is best explained with an exercise.
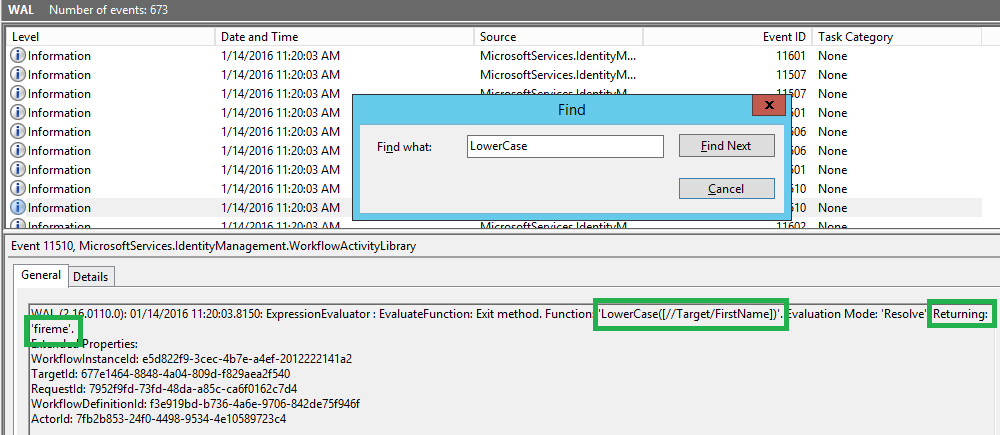
The below screenshot shows an example where I'm debugging a Run PowerShell Script AuthZ activity that has the Activity Execution Condition defined as Contains(LowerCase([//Target/FirstName]), "fireme"). I want to know if the execution condition evaluated to true or false and why. I open the event log and click Find button to search for "Contains" word. As you can see from the screenshot below, in this instance the execution condition returned true.
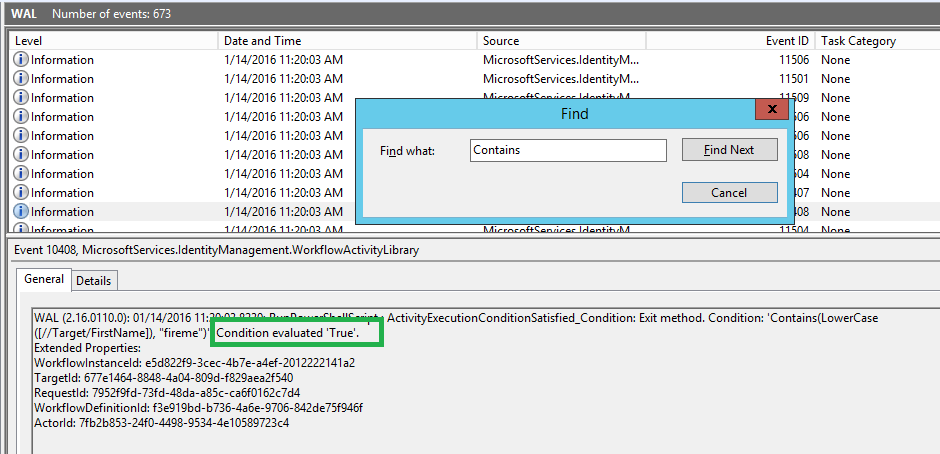
And clicking Find Next jumps to the following event:
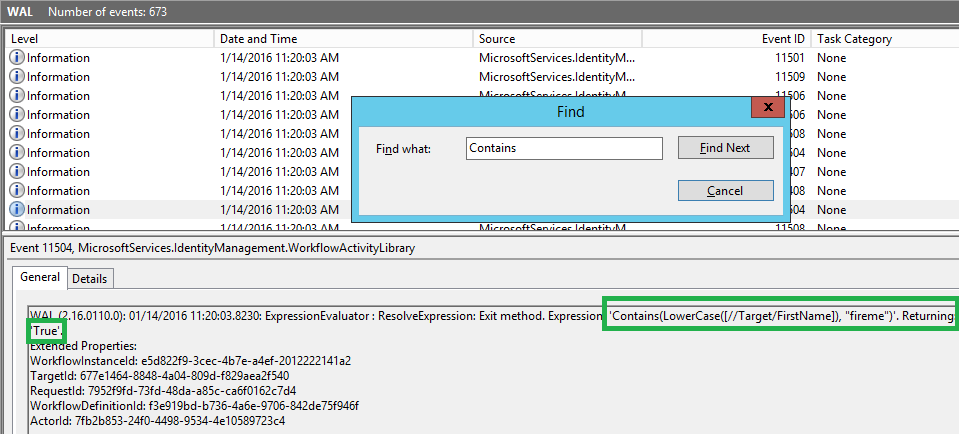
Notice that the event log entries also include critical request information such as RequestId, TargetId, WorkflowInstanceId, etc. which is makes it possible to correlated events in a busy environment.
Now to check why the condition is returning true, I can check what the result of LowerCase function is, so I search for "LowerCase" word and after a couple of clicks, I see that it's returning "fireme". No wonder then Contains is returning true!
...Or I may equally wonder why it is returning "fireme" when I submitted the request to update the FirstName to be "don't fireme". This will need a couple of seconds of thinking, but not more than that. I should quickly realise that this is an AuthZ workflow and hence
[//Target]lookup will always return existing / old values. This is my problem and I should be using the[//Delta]or[//Effective]lookup instead. So I go back and fix my Activity Execution Condition appropriately. And after that fix that I may still not get it working quite as expected. The trace log will help of course, but to solve the puzzle and have an ultimate fix I'll need to check the specs for theContainsfunction. But for now, let's continue.
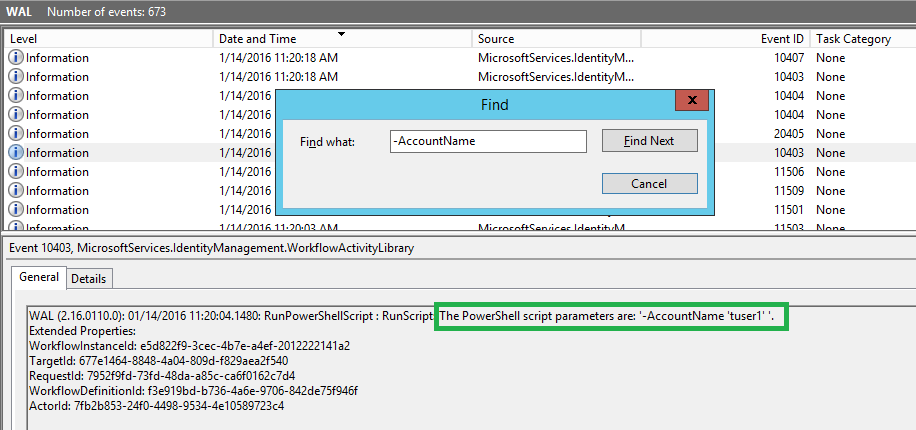
I want to check what all parameters that are passed to my script. The script used in the activity is the exact same InvokeImmediateTermination script from the Wiki for Run PowerShell Script activity that uses powershell.exe to launch a separate process to run PowerShell 3.0 Cmdlets. I search for parameter "-AccountName" and I see following:
I'm now curious to check the debug messages from my script. I search for "ActiveDirectory" and get following:

Notice that
Set-ADUseris getting invoked for "tuser1" as expected. Also notice that contrary to all other event, the debug messages from the script did not log request details such as RequestId, TargetId, WorkflowInstanceId, etc that other events logged. This is because the script used a simpleWrite-Debug $commandstatement and not the recommended extended logging function from theRunPSLoggingSample.ps1script.
This concludes our exercise. As you can see, within a couple of minutes, you can get complete picture of the runtime behaviour of your workflows and successfully debug your workflows irrespective of the complexity of logic you put in them.