Self-contained micropython script for microcontrollers that can run micropython firmware (e.g. RP2040-based Raspberry Pi Pico or ESP32 boards, and likely others), to monitor air quality parameters (VOC, PM1.0, PM2.5, PM4, PM10 and such), using connected I²C Sensirion SEN5x sensor (e.g. SEN54 or SEN54 in a box) and display/export that data via basic http web interface, with some charts there.
Device is expected to have a WiFi chip (to access WebUI on it over http), which is also setup by the script from a simple ini config, but it can be disabled and any other network interface pre-configured instead, e.g. from a separate boot.py file or by adding a couple lines for it to main.py.
Intended use is for temporary air quality control/monitoring during forest-fire seasons or periods of weather conducive to smog accumulation, and to check which measures are effective at minimizing exposure to such pollution in specific areas (e.g. when to close windows, how much air circulation to cut off, effects of other factors like air filters, air washers, indoor humidity, etc), using rp2040+sen5x as a fancy meter device, without needing any other setup (servers, dbs, cloud infra, internet or anything else external - it's all on-device local).
All data that script collects is only stored in volatile memory, and should be exported from device and preserved in a more permanent manner before shutting down or relocating it as necessary.
Repository URLs:
- https://github.com/mk-fg/rp2040-sen5x-air-quality-webui-monitor
- https://codeberg.org/mk-fg/rp2040-sen5x-air-quality-webui-monitor
- https://fraggod.net/code/git/rp2040-sen5x-air-quality-webui-monitor
Built-in WebUI should look/work something like this:
https://mk-fg.github.io/rp2040-sen5x-air-quality-webui-monitor/docs/index.html
Or here's a screenshot of how it looks, as of bf06d86 / 2023-07-02 (might be old):

See How to use this section below for more detailed explaination, but gist of it can be summarized in the following block of shell commands:
## Upload micropython firmware to the device, install "mpremote" tool

% cp config.example.ini config.ini
## Edit that config.ini file, to setup local device/network parameters

% mpremote cp config.ini :

% gzip <webui.js >webui.js.gz
% mpremote cp main.py webui.js.gz d3.v7.min.js.gz favicon.ico.gz :
% mpremote reset

## Connect to AP and go to http://192.168.4.1 or whatever IP it gets in STA mode
If it looks confusing, see below for a longer description of all these steps.
All functionality on the device is implemented by the main.py script, which needs following things in order to work:
MicroPython firmware installed on the microcontroller board.
Download page for it has a silly-long list of supported devices, with their own install links/instructions/notes, but on RP2040 (for example) it goes something like this:
- Pick/download the right .uf2 file (e.g. from rp2-pico-w page for RPi Pico W).
- Connect tiny board with BOOTSEL switch pressed on boot (or something like it), so that it will appear as a USB mass storage device (aka flash drive or usb-stick).
- Copy UF2 file there, it'll auto-reboot into micropython as soon as copying is done.
For all further interactions with the thing, I'd recommend installing official mpremote tool (use pipx for clean installs). Running it should get a python shell prompt on connected device, it allows to copy/run files there easily, and is used in all examples below.
Running mpremote will automatically connect to the device. Press Enter if you don't see a prompt there, Ctrl-x or Ctrl-] in its console to disconnect, Ctrl-c to stop currently-running script (if any), Ctrl-d to soft-reboot the controller.
Tested to work with micropython 1.20.x - 1.22.x, and should likely work with all future versions as well, as they rarely break backwards-compatibility.
config.inifile with configuration parameters, uploaded to device.See config.example.ini file in the repository, copy/edit that (basic ini file), and upload using e.g.
mpremote cp config.ini :command (mpremote tool).Might be a good idea to enable all verbose=yes options there for the first run.
Wi-Fi configuration can be removed to not configure WLAN interface, in which case script should be able to run on devices that don't have it, logging data to console if verbose=yes is enabled in
[sensor]section.Optional step, to actually see data in the browser - upload
webui.js.gz,d3.v7.min.js.gz,favicon.ico.gzfiles to the device flash as well.gzip <webui.js >webui.js.gzcan be used to make compressed version of the frontend JS code and upload that instead ofwebui.jsfor efficiency, but either one should work.Without these files, WebUI will only display data download links.
Main script can be started via mpremote like this: mpremote run main.py
Should log messages/errors over USB /dev/ttyACMx or UART to mpremote or any other serial tool connected there (like screen or minicom), esp. if verbose logging is enabled in config sections, and also connect to network as configured (or log why not), with its WebUI accessible via usual http://<ip-addr> URL (note - http: only, not https: - at least not at the moment).
After "run main.py" command, Ctrl-C will stop mpremote showing its output, but to actually stop it, either run
mpremoteto connect to repl console and Ctrl-C-interrupt it there, or e.g.mpremote soft-resetcommand.In Access Point mode (setup via
[wifi-ap]config section), use DHCP server's IP address - something like http://192.168.4.1 - likely .1 in the right subnet, and in Client/STA mode ([wifi-client]section), it should be assigned through DHCP from the connected AP/router.Dynamic DHCP addrs should always be logged over serial when they change, but there's also an easy way to print those from python anytime, for example:
% mpremote exec 'import network; print(network.WLAN().ifconfig())'Or same thing in the
>>>python prompt on device console.
If main.py file is copied to the fw storage (next to config.ini there), it will be automatically started when device powers-up (must be named either "main.py" or "boot.py" for that), but can be stopped anytime via terminal in the same way as with "run" command above - connect and Ctrl-C or soft-reset into REPL.
Quick TL;DR how-to-use version section above has a more succinct version of these steps and required commands to do a basic setup of the whole thing, and can be used as a concrete example of how to do it or for later reference.
main.py can also be compiled into an .mpy module file to take less storage space on the flash and start faster - see Setup to auto-run efficiently as .mpy file section below for that.
See Repository contents below for more information on other optional files.
Pinout diagram of the device used to run the main script should have I2C (aka I²C, IIC) bus pins (SDA/SCL for data/clock), as well as GND and 5V voltage pins (or VBUS/VSYS - same thing as 5V for the purposes of connecting the sensor).
SEN5x should be connected to same I2C SDA/SCL pins, powered via VDD/GND pins, and have its SEL pin connected to GND pin as well. With RPi Pico W for example:
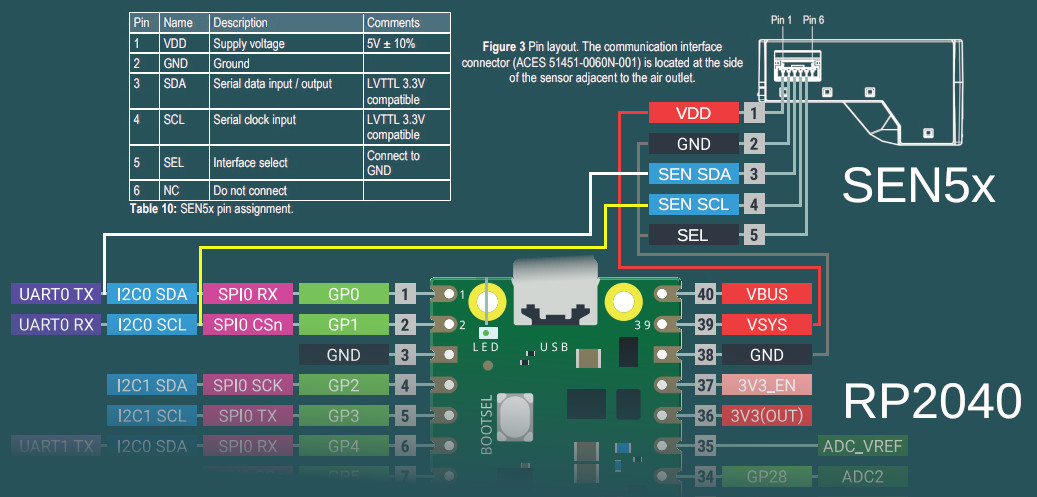
With Grove interface on a packaged SEN54 module, it's the same idea -yellow/white wires being I2C SCL/SDA respectively, and red/black are VDD/GND ones.
Microcontrollers can have multiple I2C interfaces, which can be exposed on different pins, all of which must be specified correctly in the config.ini file uploaded to flash, using controller-specific numbers for pins (e.g. GP<n> for RP2040, with 0 as in GP0 instead of number for a physical pin).
For example, with wiring as per image above, following values should be used there:
[sensor]
i2c-n = 0
i2c-pin-sda = 0
i2c-pin-scl = 1
Board pinouts can usually be found on the vendor site, like here for RPi Pico W.
There is also more info on pinouts, wiring and electrical stuff in datasheets for these devices.
Aside from documentation (like this README), useful files in the repository are:
main.py - micropython script to run on the device.
Runs 3 main components (as asyncio tasks) - WiFi AP or scanner/monitor, I²C sensor data poller, http server for WebUI and data exports.
config.example.ini - example ini configuration file with all parameters, and comment lines describing what less obvious ones are for.
Intended to be used as a template for creating required
config.inifile to upload to device, but can be also useful to track changes in wrt new features, modified defaults and such, when updating to new code from this repo.webui.js - JavaScript frontend code for WebUI data visualization.
Sent and runs in the browser as-is, fetches current data in binary format on page load, and creates interactive visualization (graphs) for it inside <svg> box.
Should ideally be uploaded to device in gzip-compressed format, as
webui.js.gz, to take less flash space, bandwidth, time to send/load, etc.favicon.ico.gzandd3.v7.min.js.gz- page icon and D3.js data visualization library, in pre-gzip-compressed form, to serve as-is as a part of WebUI from the device.Both can be optional - if
d3-load-from-internet = yesis enabled in configuration file (default - disabled), then d3 will be loaded from its official CDN URL, and missing tab icon is not a big deal.D3 is a modular lib, and its
d3.v7.min.js.gzbuild in the repository only includes following components that are used bywebui.jscode:d3-array d3-axis d3-delaunay d3-scale d3-selection d3-shapeIt can be easily rebuilt from its d3/d3 source repository, by cloning it, editing
src/index.jsto only import parts used/required bywebui.js, and rebuilding it with following command (as of v7 releases, at least):npm install . && ./node_modules/.bin/rollup -c gzip <dist/d3.min.js >d3.v7.min.js.gzOtherwise, minified D3 build with all of its components can also be fetched from https://d3js.org/d3.v7.min.js URL, e.g. if you want to change WebUI and want to use more D3 stuff in there.
D3 can have breaking changes between major releases (like 7.x.x -> 8.x.x), so likely best to use last version of a major release that
webui.jsis intended to work with, but newer ones can be selected viad3-api = ...opt inconfig.ini- probably also only relevant for development purposes.docs/ - images and examples used in this README file, as well as any dev helper scripts.
./docs/run-webui-http-server.pycan be used to run a testing http server (on http://localhost:8000 ), with same WebUI as on devices and some example data, to tweak frontend JS easily../docs/make-snapshot-html.pyis to create self-contained single-file HTML from any downloadedsamples.8Bms_16Bsen5x_tuples.bindata-export file, with all JS and data embedded in it, which can be opened in any browser -essentially to Convert exported samples.bin into an interactive chart file.
CSV and binary data exports are available via links at the top of WebUI index page.
Sensor data is only stored in volatile memory, so using these is necessary if it will be needed in any way later.
CSV (comma-separated values plaintext format, .csv file) should be mostly self-descriptive, with the header containing following columns (and data rows following that):
time_offset, pm10, pm25, pm40, pm100, rh, t, voc, noxWhere time_offset is a time delta of the sample, in seconds, offset from current time, as tracked by the micropython's time.ticks_ms() monotonic timer. Real-Time Clock (RTC) is not used at the moment, as it is not expected to be set, so there're only "time from now" offsets available, from the time of http data request, likely reflected in creation/modification timestamps on the downloaded CSV file.
Due to device performance limitations, CSV file download might take couple seconds, depending on the data size (number of collected samples, limited by sample-count config option), as conversion for it is done on the http-server side, and is not implemented efficiently in the code.
CSV files are supported by pretty much any data-processing software, and can be imported into common spreadsheet apps like MS Excel.
Binary data export (.bin file) is much more compact and efficient than plaintext CSV above, and consists of concatenated timestamp-sample tuples:
<data> ::= <data_tuple> <data>
<data_tuple> ::= <time_offset_ms [double]> <sen5x_sample>
<sen5x_sample> ::=
  <PM1 µg/m³ *10 [uint16]>
  <PM2.5 µg/m³ *10 [uint16]>
  <PM4 µg/m³ *10 [uint16]>
  <PM10 µg/m³ *10 [uint16]>
  <relative_humidity % *100 [int16]>
  <temperature °C *200 [int16]>
  <VOC *10 [int16]>
  <NOx *10 [int16]>
Note that <sen5x_sample> values above are exact raw samples as returned by the connected SEN5x sensor over its I²C interface, and are described in much more detail in its datasheet (linked on the manufacturer/product page, e.g. from SEN54 product page here).
All integer values are big-endian, and should be divided by some coefficient (by 10 for PM values, 100 for RH, 200 for T, etc) to produce actual value -again, exactly same as described in the sensor datasheet, so check there if in doubt as to how to interpret those.
<time_offset_ms> is a big-endian double-precision floating-point negative value, with same meaning as time_offset field in CSV table described above, but in milliseconds here instead of seconds.
Such custom binary format should be easy to parse by any code, and is much more efficient in pretty much all ways than CSV, especially to generate on a potentially underpowered microcontroller, using multiple orders of magnitude less CPU cycles there.
Samples should be returned in most-recent-first order, but with (relative) timestamps in there, it's more like an implementation detail and shouldn't matter or be relied upon.
Exported binary file can be dropped into docs dir (instead of samples.8Bms_16Bsen5x_tuples.bin example file there) to see the data via same WebUI anytime later (via python3 docs/run-webui-http-server.py on http://localhost:8000 or python3 -m http.server), or also it can be converted to single-file html vis - see Convert exported samples.bin into an interactive chart file section below for more info on that.
main.py is a python script, which normally micropython would have to parse and then byte-compile every time before running.
This is useful for testing changes in the script using e.g. mpremote run ... without extra steps, but when running same script every time board boots, it's a waste of time, and can be skipped by pre-compiling the script into .mpy module, which will take less extra work to load.
It can be done something like this:
Build/install mpy-cross tool - maybe from an OS package, or from sources.
It has no significant dependencies, usual "make" should produce
./build/mpy-crossbinary (see also Arch PKGBUILD for it here).Run
mpy-cross -march=armv6m -O2 main.py -o aqm.mpyto buildaqm.mpymodule file.See official docs on .mpy files for more info on picking compiler options above.
Upload produced
aqm.mpyfile and test-run it:% mpremote cp aqm.mpy : % mpremote exec 'import aqm; aqm.run()'Should run it same as
mpremote run main.py, just a bit faster, without any errors or issues.Make and upload loader file to run
aqm.mpyon board boot.Same code as in "exec" command above can be uploaded to
main.pyfile on the board's flash storage to import/runaqm.mpyon boot:% echo 'import aqm; aqm.run()' >loader.py % mpremote cp loader.py :main.pympremote resetor power-cycle device, check that everything runs correctly.If verbose logging is enabled, running
mpremoteor connecting to device usb-tty should have the same output there as when test-running main.py earlier.
Even more optimization can be done by embedding "frozen bytecode" into board's micropython firmware image using a manifest file, in which case it will run directly from flash storage and not use RAM for that - faster, and leaving more memory to buffer samples (by ~21 KiB I think), but a bit more hassle to build/upload -see documentation on MicroPython manifest files for how to do it.
Downloaded .bin files have the data, and it can be sometimes useful to take a look at what's in such file, or maybe share it, which can be easily done using docs/make-snapshot-html.py script.
Running ./docs/make-snapshot-html.py samples.8Bms_16Bsen5x_tuples.bin will create a self-contained snapshot.html file in the current dir, with all data and scripts needed for its visualization embedded in it.
Opening such html in any browser (via double-click, File-Open, python -m http.server, or dropping it into http-accessible dir somewhere) should produce same chart as in device WebUI from where that data was exported.
Run that script with -h/--help option for more parameters.
Samples .bin file does not have absolute timestamps in it, only offsets from "time of the download", so modification time on the file is used as that baseline, and might be important to preserve for time axis on the chart to be correct.
make-snapshot-html.py works by loading the bin file, docs/index.html as a template for output, and embeds base64-encoded data and all javascript sources into it. Needs to be run from repository dir to have access to all these components. Doesn't work on exported CSV files, only .bin ones.
Poller can send simple UDP "value over threshold" alerts from the device to specified destination, and snooze those per-dst if it gets responses. See [alerts] section in config.example.ini for enabling that.
These are not intended for long-term reliable alerting/monitoring or controlling anything important, but for transient info like desktop notifications (see e.g. aqm-alerts script for that use-case).
Alert UDP-packet payload format:
<alert> ::= <data> <crc [2B]>
<data> ::= <sen5x_sample [16B]> <over_threshold_keys>
<over_threshold_keys> ::= <key> [ " " <over_threshold_keys> ]
<key> ::= "pm" | "rh" | "t" | "voc" | "nox"
<crc> ::= CRC-16-OpenSafety-A( <data> )
CRC-16 used here is a simple CRC-16F/5 / 254465s / CRC-16-OpenSafety-A with 0x5935/0xAC9A polynomial and no xor/reverse nonsense (see 16-bit CRC Zoo for more info). <sen5x_sample> is same data as received from the sensor (circa crc8 checksums), and same as in binary Data export formats.
Alert packets should be generated for every over-threshold sample, unless suppressed with a response packet to origin socket, with a list of threshold-keys to ignore and for how long (in seconds):
<alert_snooze> ::= <data> <crc [2B]>
<data> ::= <seconds [double]> <snooze_keys>
<snooze_keys> ::= <key> [ " " <snooze_keys> ]
If alert was processed successfully, such reply can have a list of keys from the received packet, sent back to its address/port, with whatever relevant snooze-delay, which will suppress alerts for any subset of keys to this address.
- Github Issue #6 has a note on how to setup this on a cheaper $2 Wemos ESP32 S2 Mini board, instead of a more expensive RP2040 ones.
- ESPHome - more comprehensive home automation system, which also supports SEN5x sensors connected to RP2040 platforms.
- Sensirion/python-i2c-sen5x - SEN5x vendor python driver code and examples (not used here).
AirGradient Open Air - a product similar to what this project does.
Intended to send data to "cloud" over internet, uses different sensors, can also be built from parts, has open-source firmware (and bunch of forks of it).
- IKEA VINDSTYRKA - also a smart air-quality meter with SEN54 sensor.
- Enable WDT, if available on RP2040, displaying reboots via it as an error in WebUI.
- More mobile-friendly WebUI visualizations.