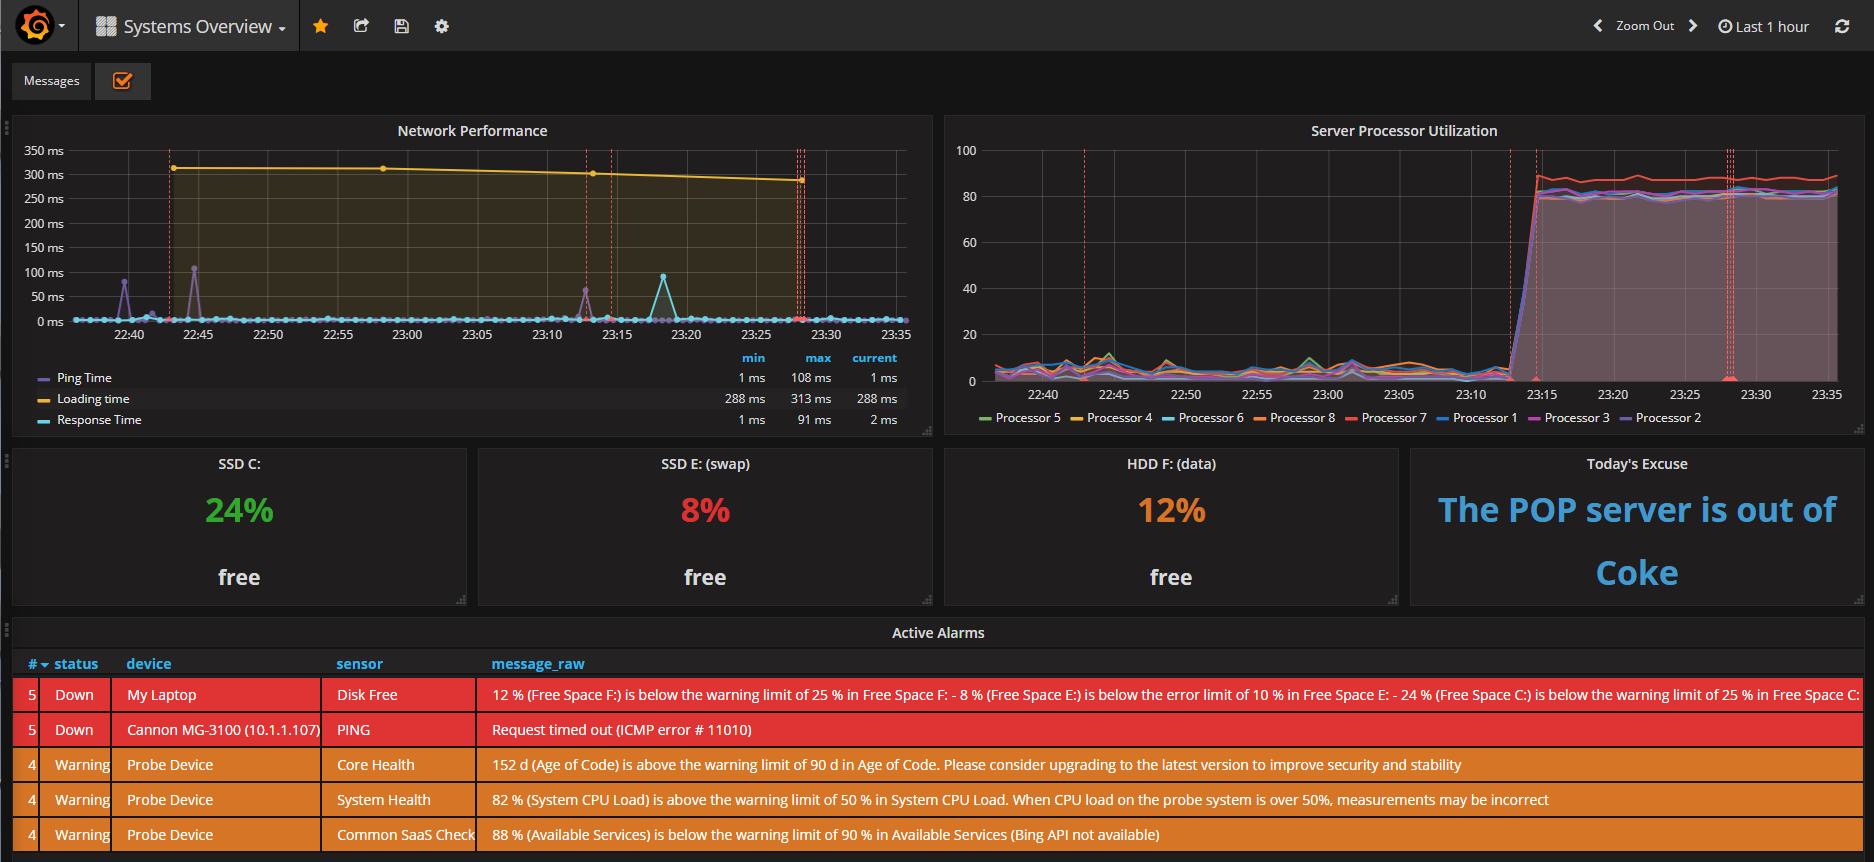
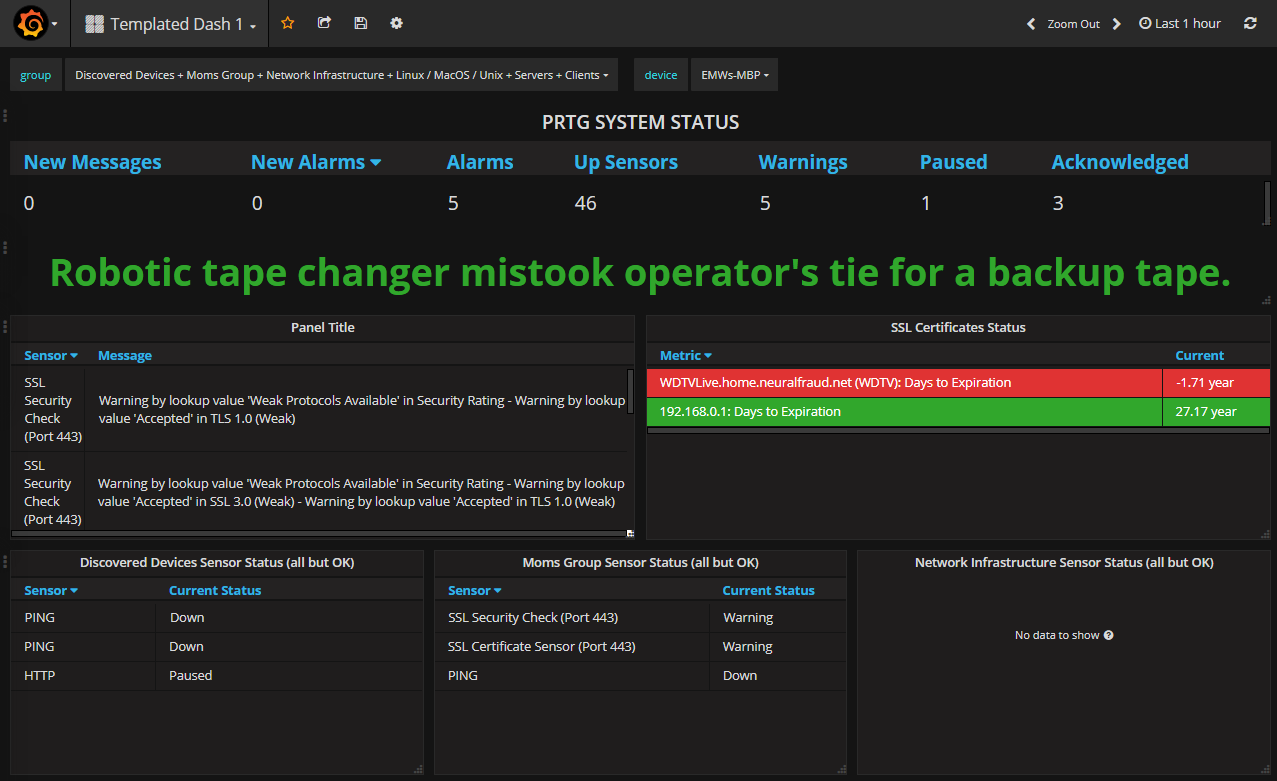
Vizualize your PRTG data with rich, powerful Grafana dashboards!
- Select multiple metrics in a single query using regular expressions
- Select from an array of PRTG metadata properties, including Status, Message, Active, Tags, Priortiy, and more.
- Query raw JSON direct from the PRTG API and render using the Table panel
- Show sensor status messages on graphs with Annotations
Clone this repo or download the zip directly into your Grafana "data/plugins" directory and check out The Grafana-PRTG Wiki to get started.
THANK YOU FOR USING THIS PLUGIN!
For more information, see The Grafana-PRTG Wiki


