A Netlify plugin to generate a Lighthouse report for every deploy
You can install the plugin for your site using your netlify.toml file or the Netlify UI.
For the most customization options, we recommend installing the Lighthouse plugin with a netlify.toml file.
netlify.toml file-based installation allows you to:
- Run Lighthouse audits for different site paths, such as the contact page and site home page
- Run Lighthouse audits for a desktop device
- Generate Lighthouse results in a language other than English
For UI-based installation, you can install this plugin from the Integrations Hub, the Plugins directory, or through this direct installation link.
To install the plugin manually:
From your project's base directory, use npm, yarn, or any other Node.js package manager to add the plugin to devDependencies in package.json.
npm install -D @netlify/plugin-lighthouseThen add the plugin to your netlify.toml configuration file:
[[plugins]]
  package = "@netlify/plugin-lighthouse"

  # optional, fails build when a category is below a threshold
  [plugins.inputs.thresholds]
    performance = 0.9
    accessibility = 0.9
    best-practices = 0.9
    seo = 0.9
    pwa = 0.9

  # optional, deploy the lighthouse report to a path under your site
  [plugins.inputs.audits]
    output_path = "reports/lighthouse.html"
The lighthouse scores are automatically printed to the Deploy log in the Netlify UI. For example:
2:35:07 PM: ────────────────────────────────────────────────────────────────
2:35:07 PM:   2. onPostBuild command from @netlify/plugin-lighthouse
2:35:07 PM: ────────────────────────────────────────────────────────────────
2:35:07 PM:
2:35:07 PM: Serving and scanning site from directory dist

...

2:35:17 PM: {
2:35:17 PM:   results: [
2:35:17 PM:     { title: 'Performance', score: 0.91, id: 'performance' },
2:35:17 PM:     { title: 'Accessibility', score: 0.93, id: 'accessibility' },
2:35:17 PM:     { title: 'Best Practices', score: 0.93, id: 'best-practices' },
2:35:17 PM:     { title: 'SEO', score: 0.81, id: 'seo' },
2:35:17 PM:     { title: 'Progressive Web App', score: 0.4, id: 'pwa' }
2:35:17 PM:   ]
2:35:17 PM: }
To customize how Lighthouse runs audits, you can make changes to the netlify.toml file.
By default, the plugin will serve and audit the build directory of the site, inspecting the index.html.
You can customize the behavior via the audits input:
[[plugins]]
  package = "@netlify/plugin-lighthouse"

  [plugins.inputs.thresholds]
    performance = 0.9

  # to audit a sub path of the build directory
  # route1 audit will use the top level thresholds
  [[plugins.inputs.audits]]
    path = "route1"

    # you can specify output_path per audit, relative to the path
    output_path = "reports/route1.html"

  # to audit an HTML file other than index.html in the build directory
  [[plugins.inputs.audits]]
    path = "contact.html"

  # to audit an HTML file other than index.html in a sub path of the build directory
  [[plugins.inputs.audits]]
    path = "pages/contact.html"

  # to audit a specific absolute url
  [[plugins.inputs.audits]]
    url = "https://www.example.com"

  # to audit an absolute url which depends on ENV value
  [[plugins.inputs.audits]]
    url = "https://${DEPLOY_PRIME_URL}/home"

    # you can specify thresholds per audit
    [plugins.inputs.audits.thresholds]
      performance = 0.8

  # to serve only a sub directory of the build directory for an audit
  # pages/index.html will be audited, and files outside of this directory will not be served
  [[plugins.inputs.audits]]
    serveDir = "pages"
By default, Lighthouse takes a mobile-first performance testing approach and runs audits for the mobile device experience. You can optionally run Lighthouse audits for the desktop experience by including preset = "desktop" in your netlify.toml file:
[[plugins]]
  package = "@netlify/plugin-lighthouse"

  [plugins.inputs.settings]
    preset = "desktop" # Optionally run Lighthouse using a desktop configuration
Updates to netlify.toml will take effect for new builds.
To return to running Lighthouse audits for the mobile experience, just remove the line preset = "desktop". New builds will run Lighthouse for the mobile experience.
By default, Lighthouse results are generated in English. To return Lighthouse results in other languages, include the language code from any Lighthouse-supported locale in your netlify.toml file.
For the latest Lighthouse supported locales or language codes, check out this official Lighthouse code.
Updates to netlify.toml will take effect for new builds.
[[plugins]]
  package = "@netlify/plugin-lighthouse"

  [plugins.inputs.settings]
locale = "es" # generates Lighthouse reports in EspañolBy default, the Lighthouse plugin will report the findings in the deploy logs. To fail a build based on a specific score, specify the inputs thresholds in your netlify.toml file. Set the threshold based on performance, accessibility, best-practices, seo, or pwa.
[[plugins]]
  package = "@netlify/plugin-lighthouse"

  [plugins.inputs.thresholds]
performance = 0.9Fork and clone this repo.
Create a .env file based on the example and run
yarn install
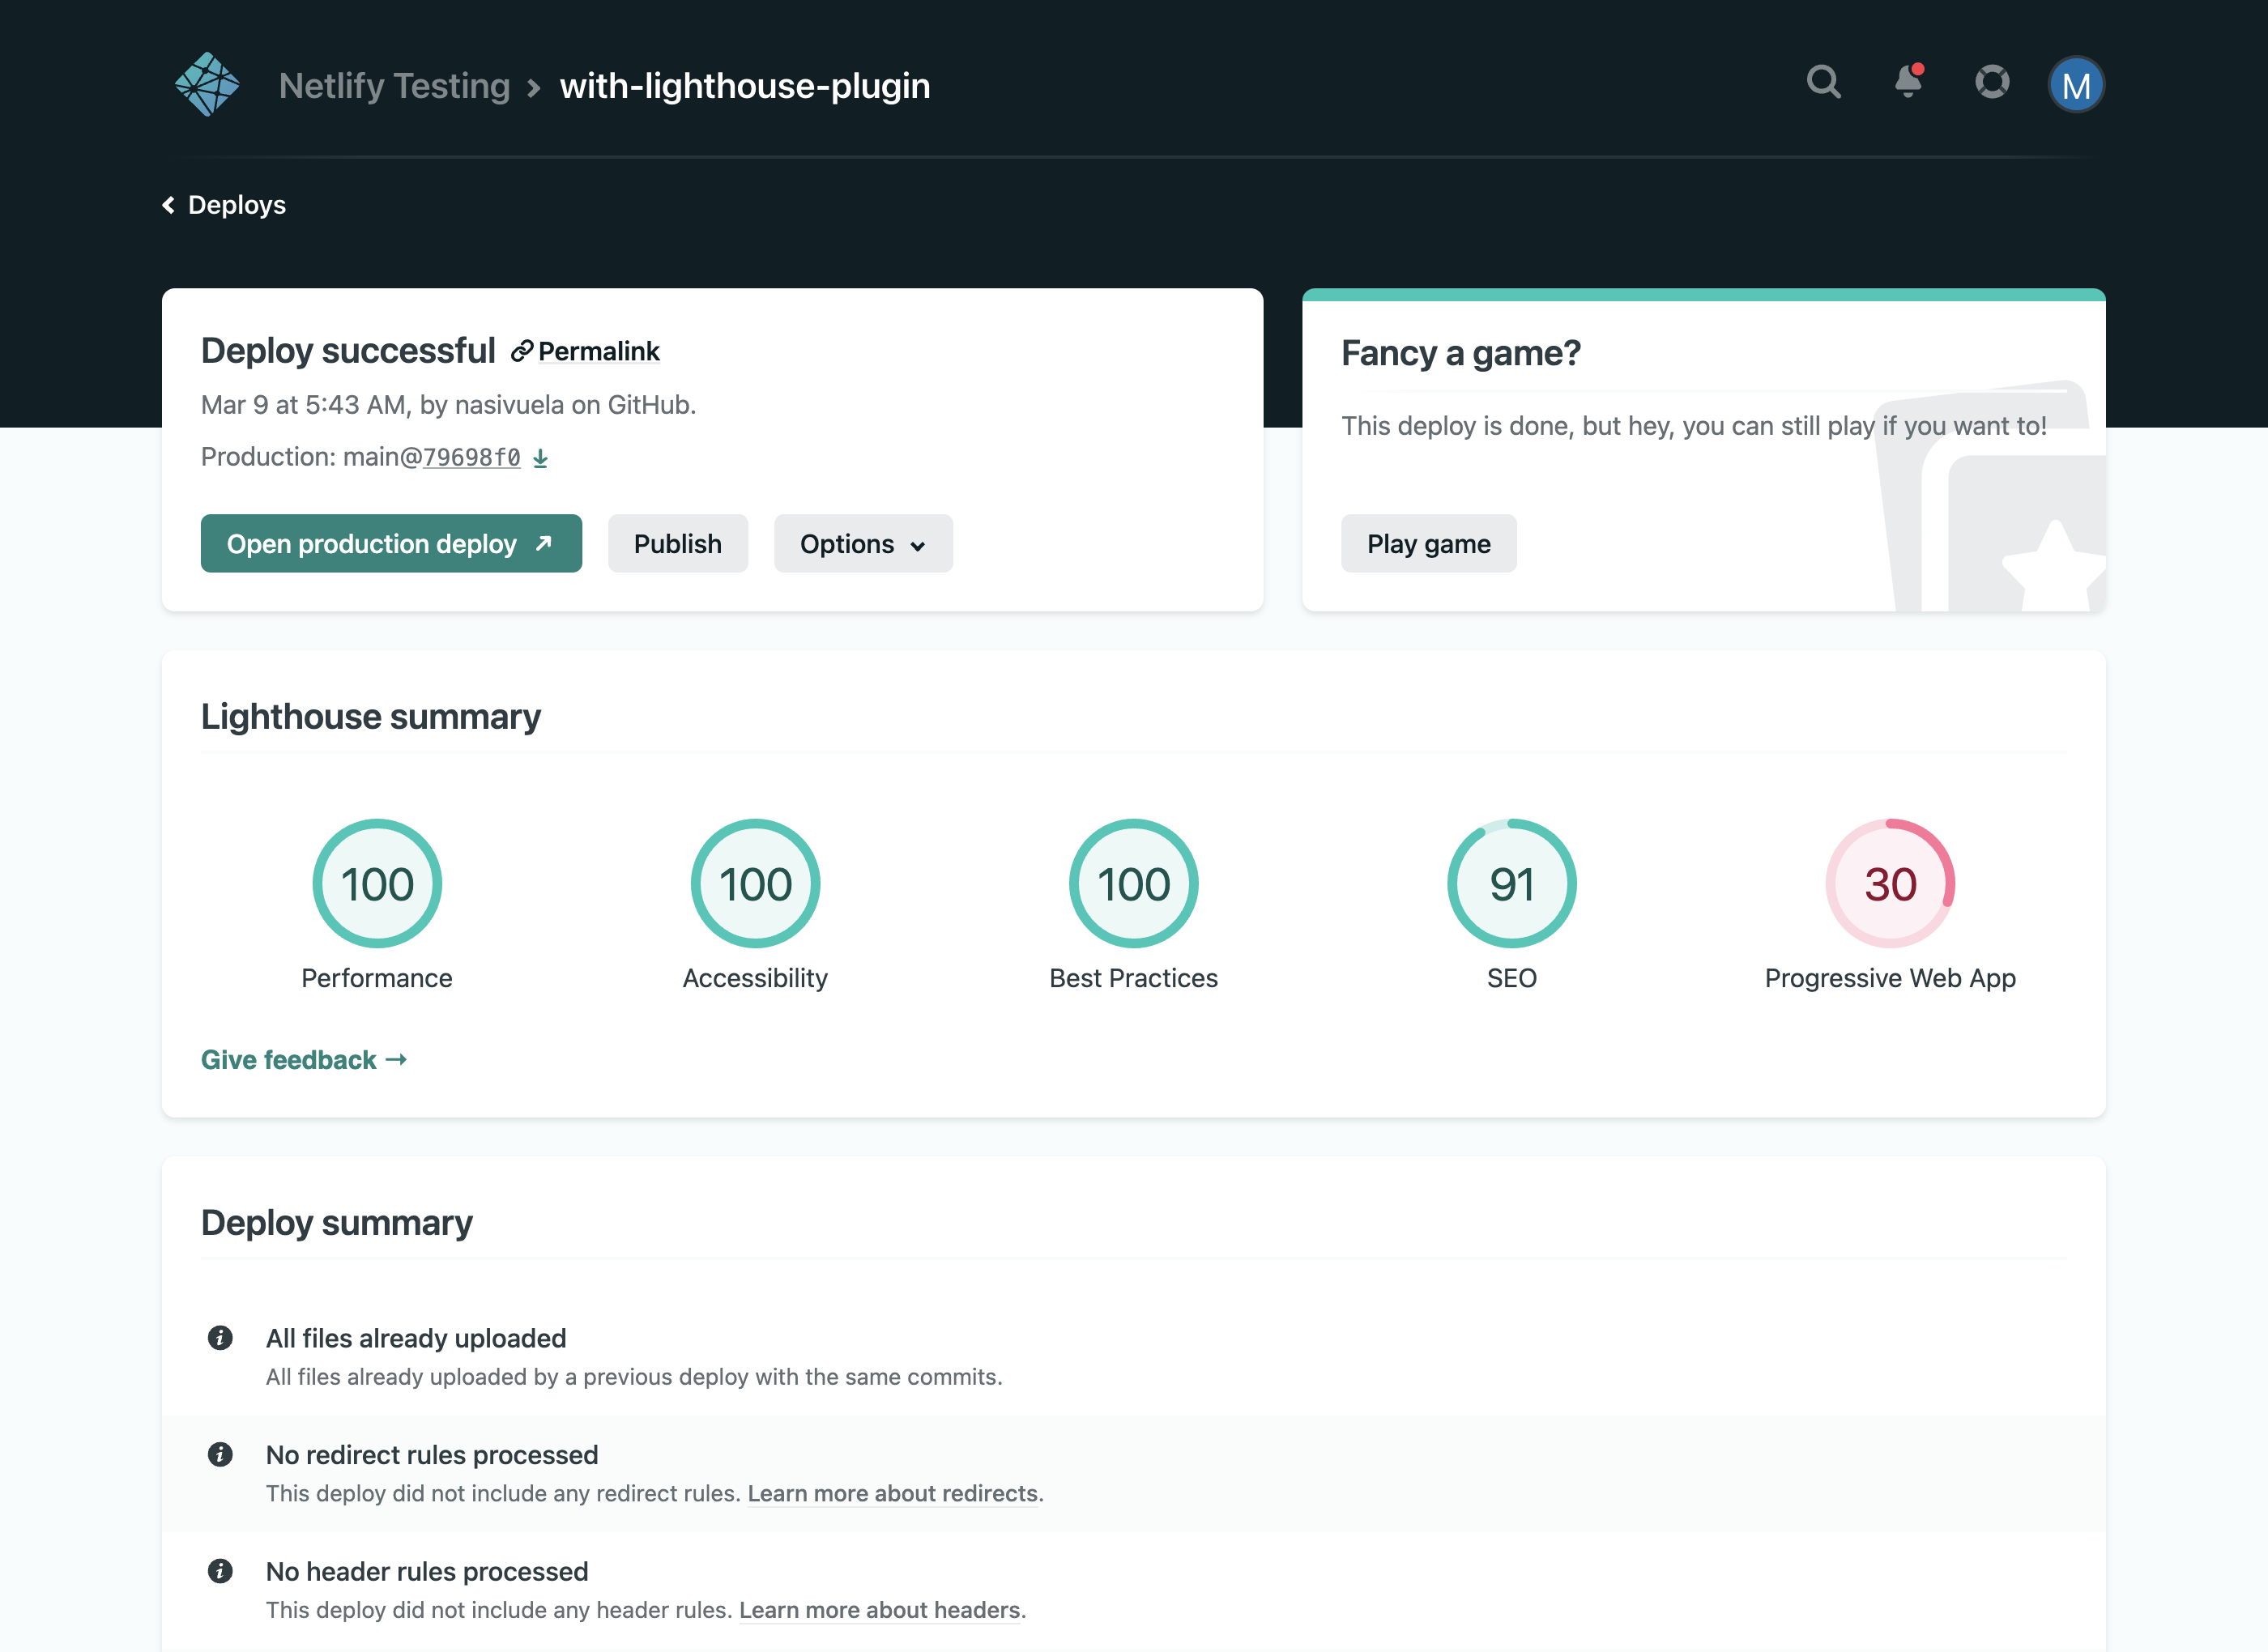
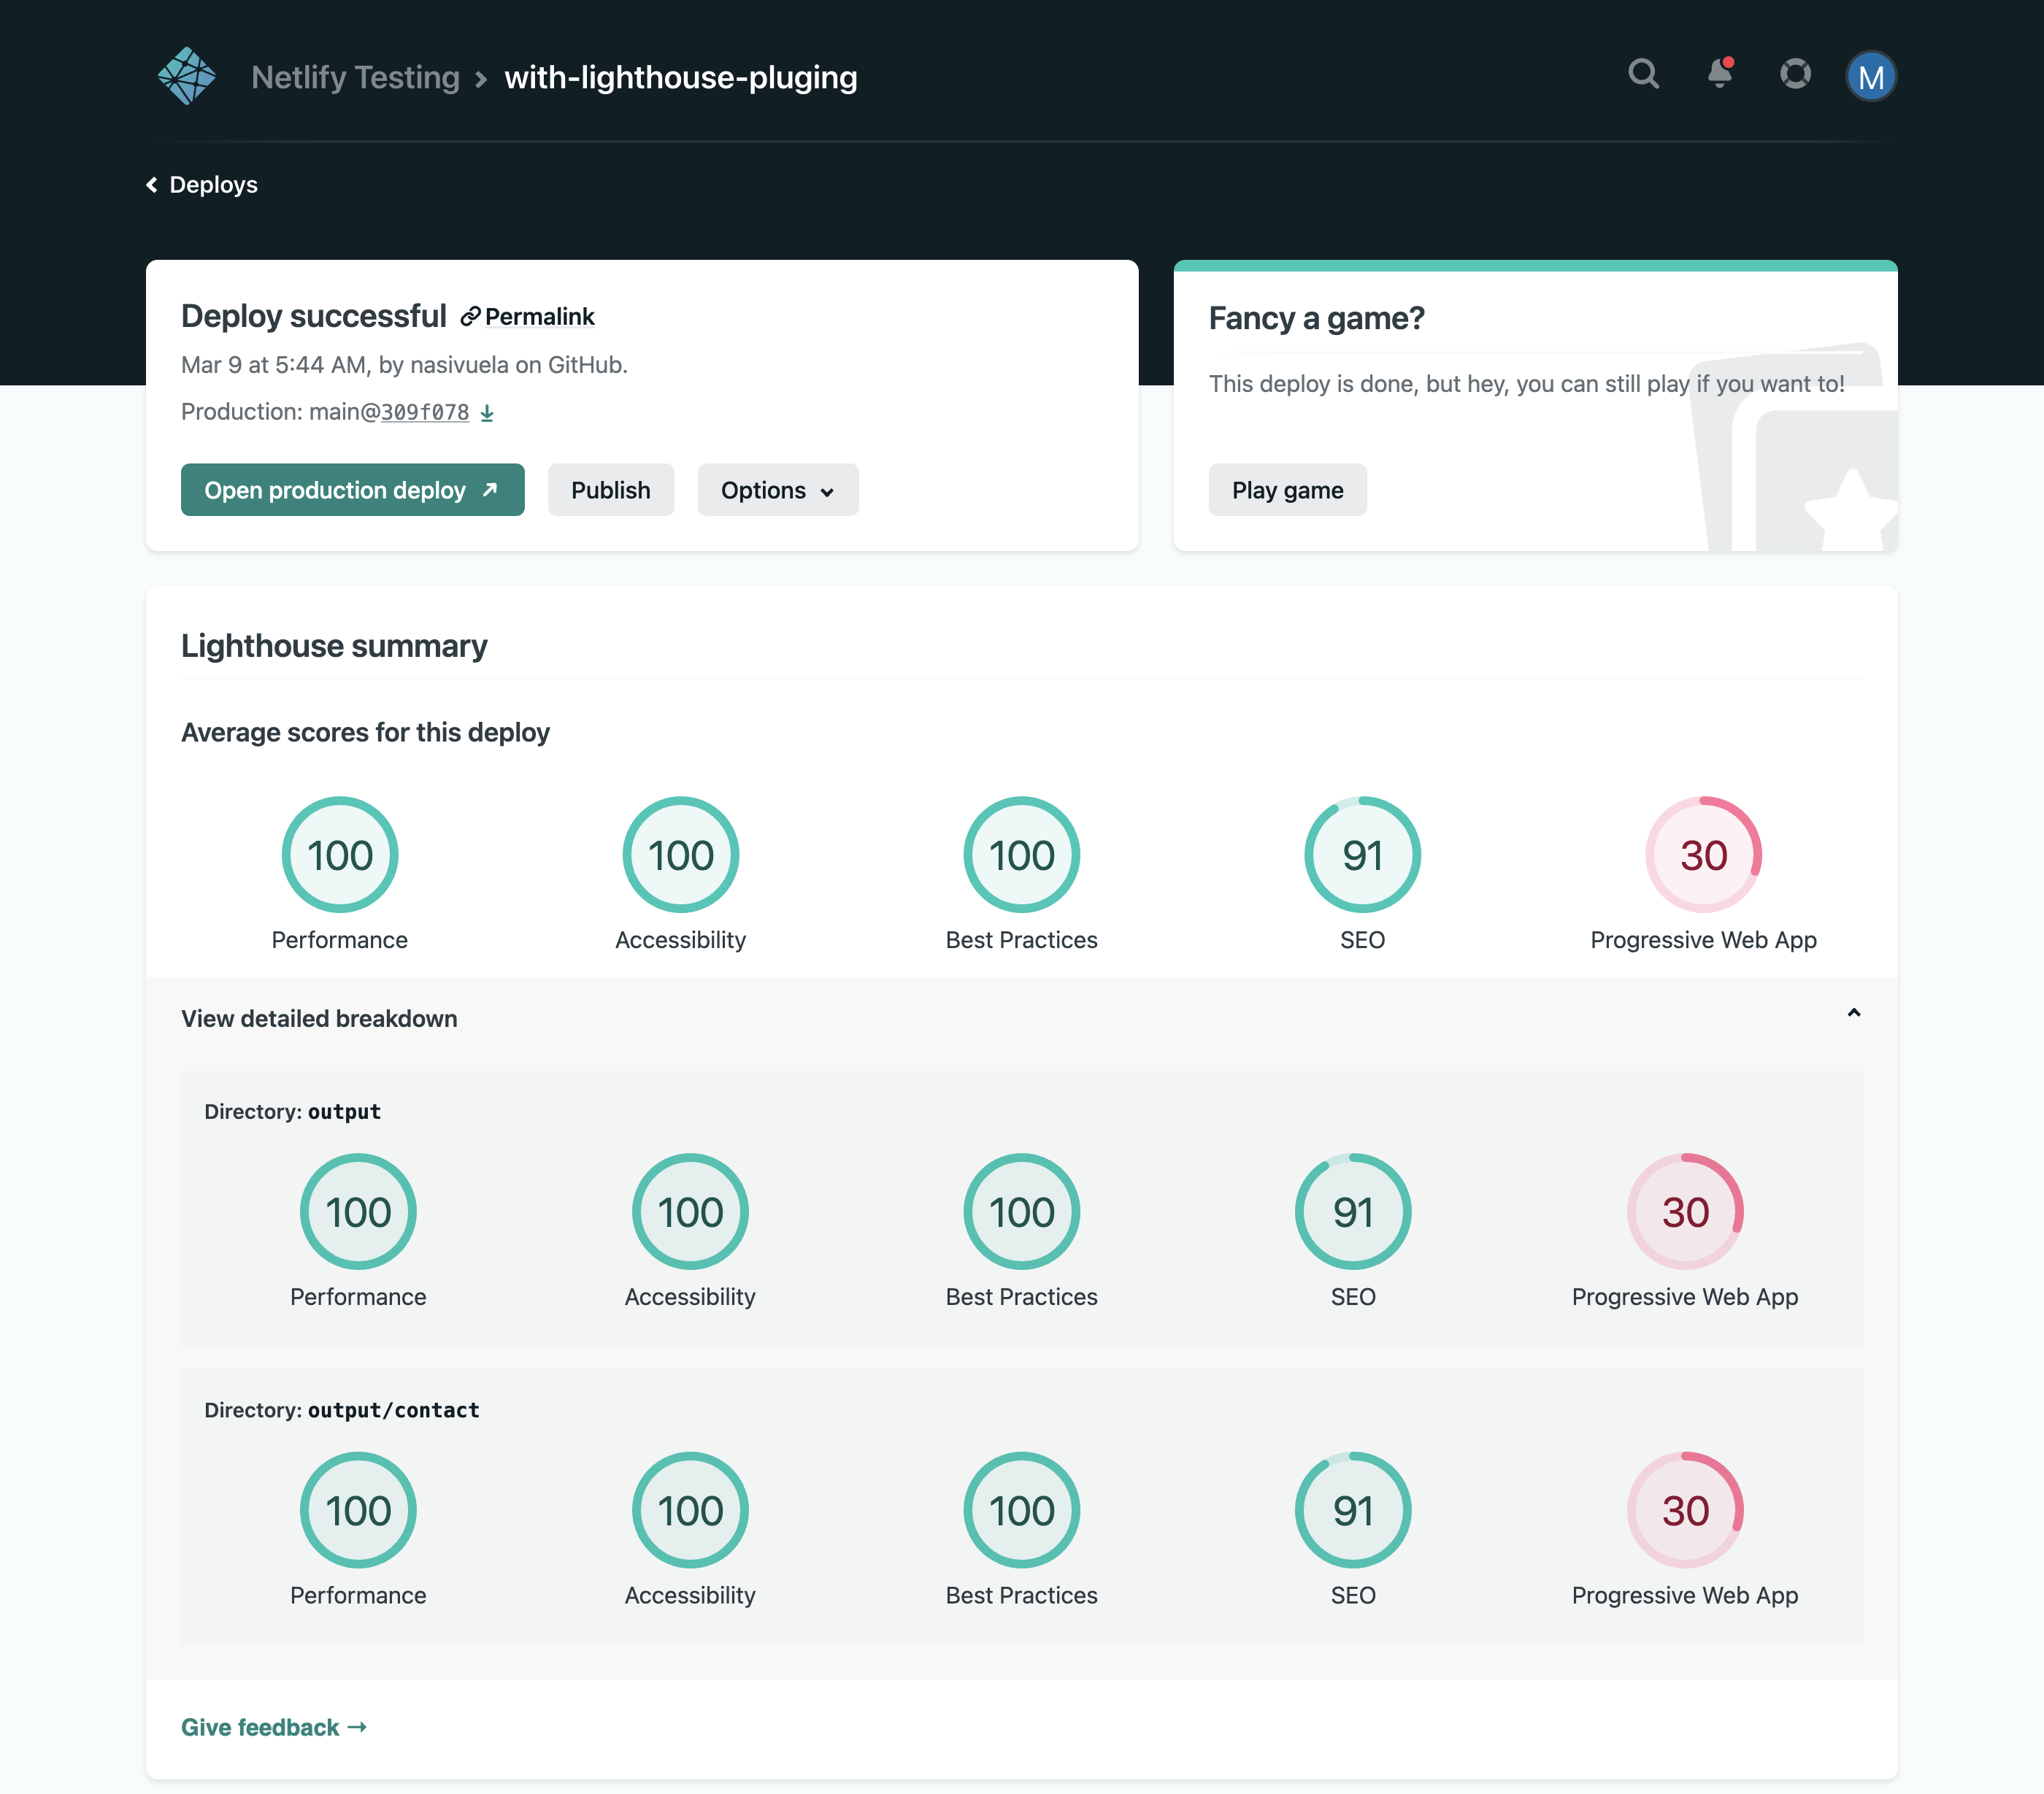
yarn localNetlify offers an experimental feature through Netlify Labs that allows you to view Lighthouse scores for each of your builds on your site's Deploy Details page with a much richer format.
You'll need to install the Lighthouse build plugin on your site and then enable this experimental feature through Netlify Labs.
If you have multiple audits (directories, paths, etc) defined in your build, we will display a roll-up of the average Lighthouse scores for all the current build's audits plus the results for each individual audit.
Some items of note:
- The Lighthouse Build Plugin must be installed on your site(s) in order for these score visualizations to be displayed.
- This Labs feature is currently only enabled at the user-level, so it will need to be enabled for each individual team member that wishes to see the Lighthouse scores displayed.
Learn more in our official Labs docs.
We have a lot planned for this feature and will be adding functionality regularly, but we'd also love to hear your thoughts. Please share your feedback about this experimental feature and tell us what you think.

