-
-
Notifications
You must be signed in to change notification settings - Fork 29
New issue
Have a question about this project? Sign up for a free GitHub account to open an issue and contact its maintainers and the community.
By clicking “Sign up for GitHub”, you agree to our terms of service and privacy statement. We’ll occasionally send you account related emails.
Already on GitHub? Sign in to your account
Basic summary stat plotting #26
base: main
Are you sure you want to change the base?
Conversation
|
The figures look good. It seems like plt.matshow |
|
seaborn uses pcolormesh under the hood. I went with their implementation
because it's pretty well tested and does all the fiddly stuff like label
organization, though open to writing from scratch eventually if that's what
we want.
…On Mon, Apr 2, 2018 at 7:15 PM, Dan Schult ***@***.***> wrote:
The figures look good. It seems like plt.matshow
could do much of this -- unless seaborn is using an algorithm to order the
nodes.
Does anyone know matshow well enough to say whether it could do more than
the seaborn heatmap for showing matrices?
—
You are receiving this because you authored the thread.
Reply to this email directly, view it on GitHub
<#26 (comment)>, or mute
the thread
<https://github.com/notifications/unsubscribe-auth/ACwxrc0FFzB5eEZ3OTwReUZPiPb7QWbjks5tkttZgaJpZM4TER8f>
.
--
Camille Scott
Graduate Group for Computer Science
Lab for Data Intensive Biology
University of California, Davis
camille.scott.w@gmail.com
|
|
It look like they also cluster the nodes using scipy clustering algorithms, so its more than just showing the matrix. Very cool... :) |
|
It might make sense to use a diverging colormap for the weighted adjacency matrix. For example, this is what I used for one of my slides in the intro talk: |
|
I'm concerned about adding seaborn as a dependency. If seaborn already supports this well, then why not just let users depend on it on their own. Adjancency matrices are not hard to plot. |
|
@NelleV They aren't hard to plot. However, it was the plot that I spent the most time on (granted I didn't have many plots) and I wasn't very happy with the final result. We should at least give them a couple of examples (in the gallery) even if we don't provide a helper function. For example, one with the names on the sides (like you provide me for my talk) would be nice to include in the gallery. It would have saved me a significant amount of time, while preparing my talk. Is there any particular difficulty installing seaborn? For example, does it need a compiler or special libraries? (Like you, I use Linux so I am not always aware of installation difficulties.) Or is your concern more a general reluctance to having too many dependencies? What do you think about adding extra dependencies to some of the examples? Another option would be to make the seaborn dependency optional (e.g., matplotlib is optional for networkx). Thoughts? |
|
Alternatively, we might also add any desired functionality to matplotlib. I ended up using seaborn because I couldn't easily figure out how to get the plots I wanted using matplotlib. Thoughts? |
|
My reasons here were:
One argument I could see against (3) is if we want to more easily support linking our interactivity support in with the adjacency matrix. |
|
I just don't see the point in adding a functionality that both matplotlib and seaborn has, and this seems sufficiently different from what we already support to at least wait before including it in the package. I think we should first focus on plotting graphs well before adding other types of plots, and that includes adjacency plots. I'm also in general concerned about adding dependencies, in particular one such as seaborn, which relies on very few contributors. The cost in terms of maintenance is always higher than what one would expect and seaborn is not a standard dependency. Adding seaborn as a dependency in the documentation seems more reasonable to me, if it is only a question of showing to people how to do this using the package (although it might be even better to add this example to the seaborn gallery). |
|
I would prefer adding the example to grave. When I started trying to figure out how to plot this, I first looked to see if it was supported by networkx drawing, then I looked at matplotlib, and then finally (after over a day of trying to get a plot I liked) I looked at the seaborn documentation. Including something in the library or in the examples would have saved me an hour or two. To produce the adjacency matrix for my talk involved Stefan writing a prototype using matplotlib, you improving it, and then me completely redoing everything in seaborn. And at the end of that process, I had plots I like less than the one in this PR. Given that it took as much time as it took Stefan, you, and me to produce something less desirable than this, I suspect either we aren't very familiar with matplotlib and seaborn as others or it is not clear how one should plot nice adjacency matrices for graphs. I don't do a lot of graph plots, but the first thing I normally look at is the adjacency matrix. It seems like a useful plot to make easy for people to figure out how to use. I don't share your concern about adding seaborn as a dependency. But if it is a widely shared concern, I am happy to defer to others. |
|
I think Jarrod has provided a nice example for my reasoning here. Also note that this implementation doesn't require seaborn to be added to grave's requirements; it fails gracefully and warns if it isn't found -- though I still am not sure if this is an antipattern. |
|
My 2 cent is that this is doing something orthogonal to the current scope of the library, and that there are plenty of features we should first be adding to the plot_network function before tackling this. It's also going to break very easily very fast (considering Matplotlib's internal), and is really hard to test. It relies on a library which is currently barely maintained, and adds not one, but two hidden dependencies (pandas is not currently a dependency of grave). I still don't think this is a feature nice enough to justify the cost of maintenance this will put on us. If we are to add this, I think we should not have hidden dependencies in our code. Pandas and seaborn should then be explicit dependencies. |
|
As a compromise, let's just say for now that we'll leave this open for a month or so and see where things are; if there's been sufficient movement in our core functionality and there's still support for summary stat plotting, we'll discuss again. |
|
I had this open to post something just now as well, I am 👍 on @camillescott 's suggestion. This sort of thing is in the list of things to support, but I agree with @NelleV 's concerns about dependencies (and hidden dependencies). When this gets re-addressed we should loop @ericmjl into the discussion. |
|
We should also discuss whether we will allow optional dependencies (I am not sure what hidden dependencies are, but they sound bad). I don't have any problems with optional dependencies. For example, in NetworkX by default The bigger question is what the scope of Grave is and who it is for. For me, the most interesting graph plots are the ones we are talking about whether to support (e.g., adjacency matrices and other summary statistics plots). Without them, Grave will be of limited interest to me. Perhaps some of this functionality could be added to Matplotlib, if it is out of scope for Grave. The other thing that Grave could do (which would be useful for me) is to allow us to remove the plotting code from NetworkX. I am also interested in whether that is in scope for Grave. |
WIP: Addresses #7.
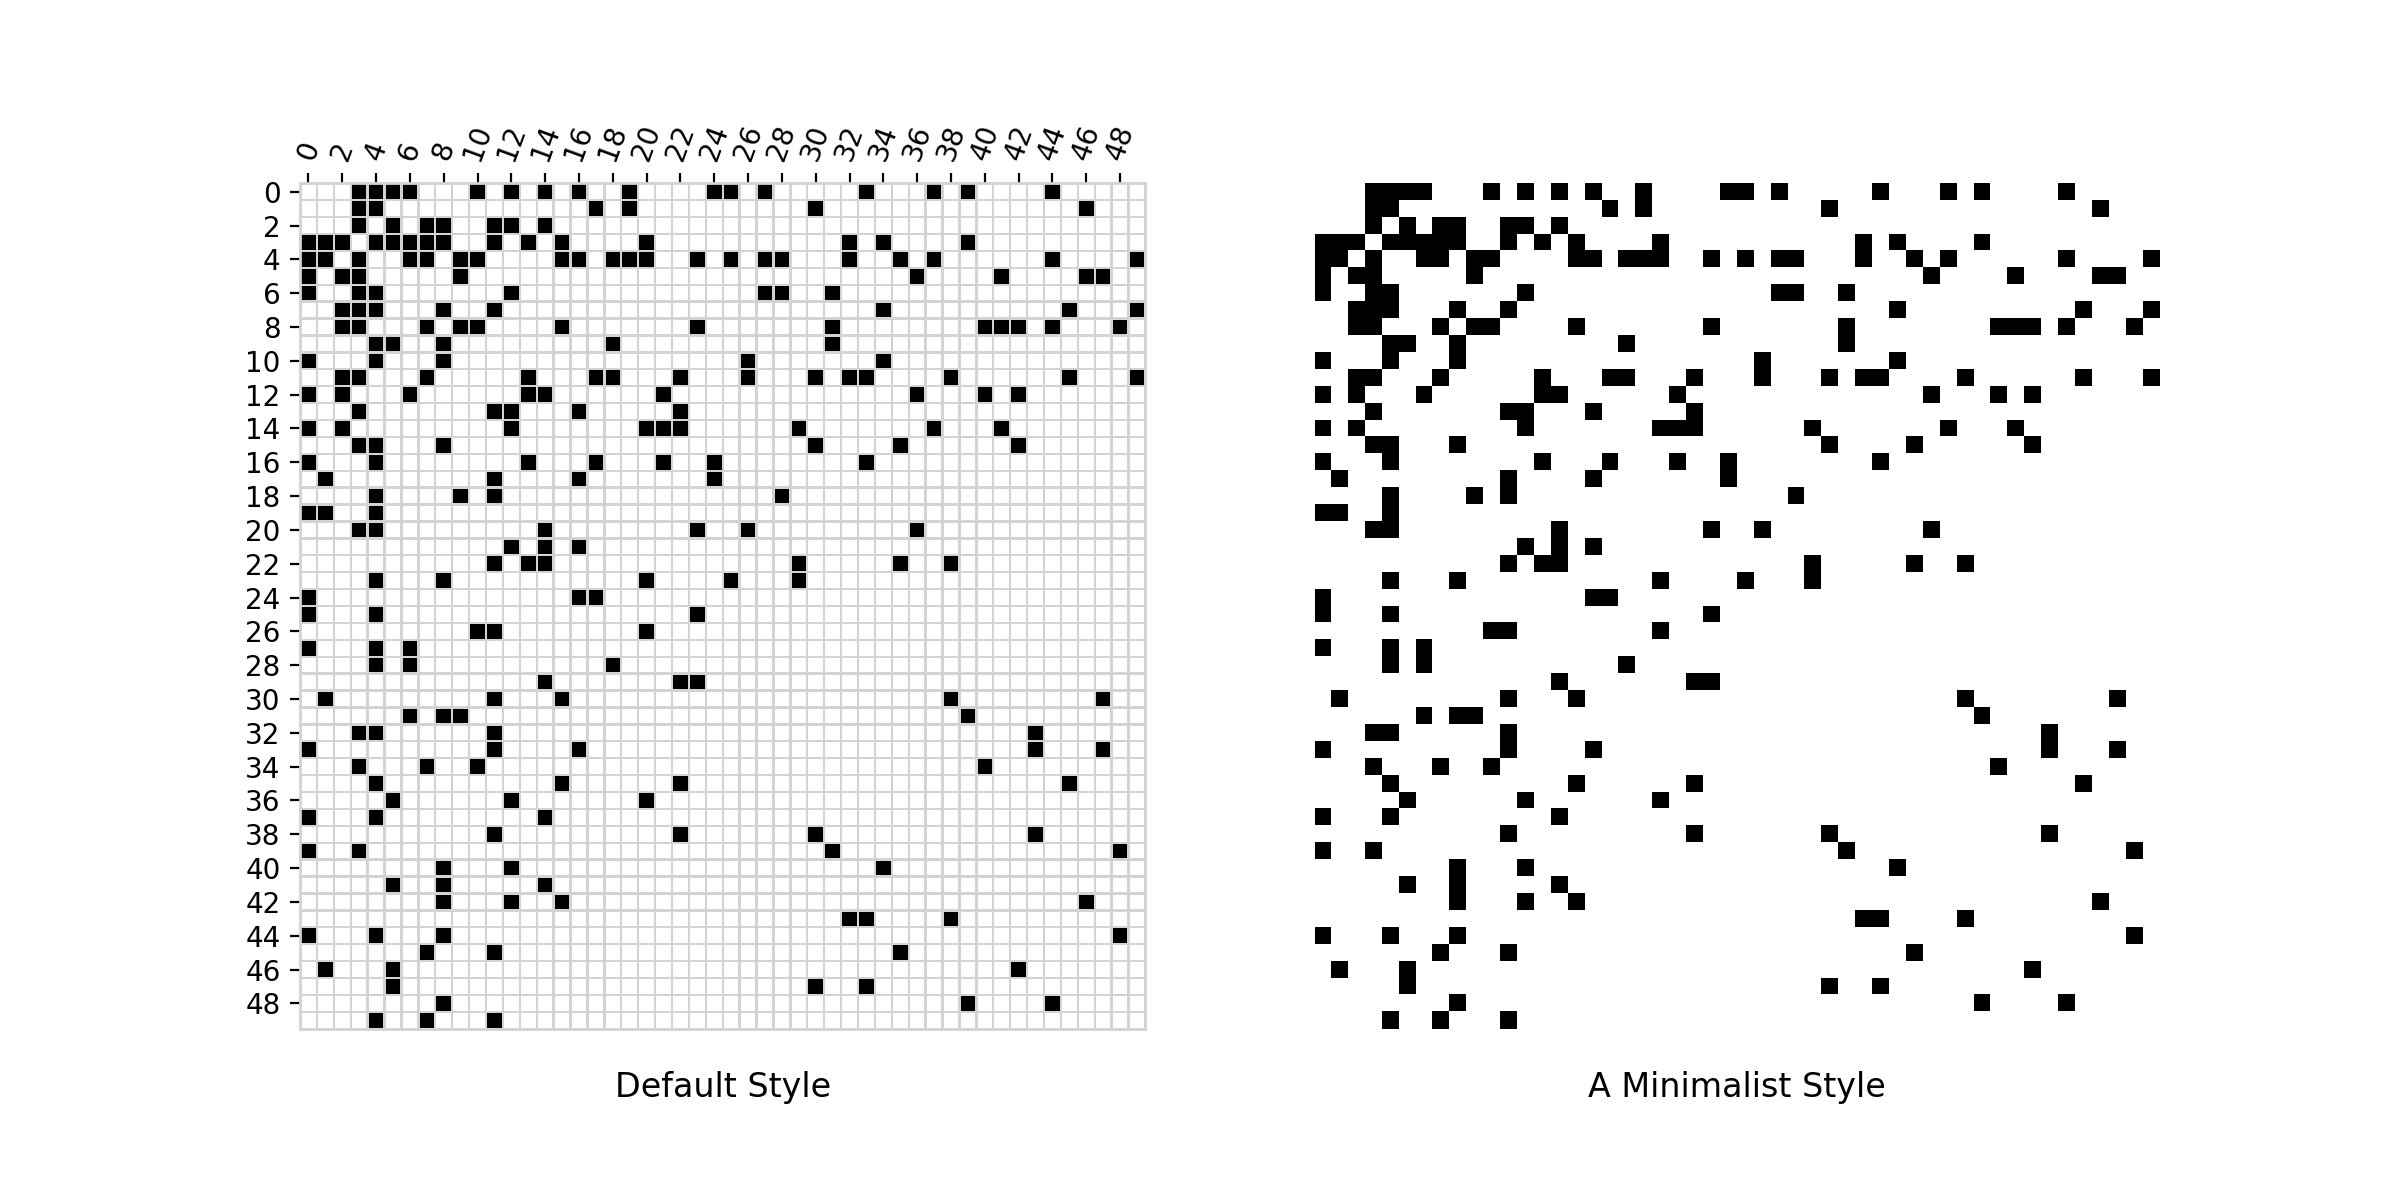
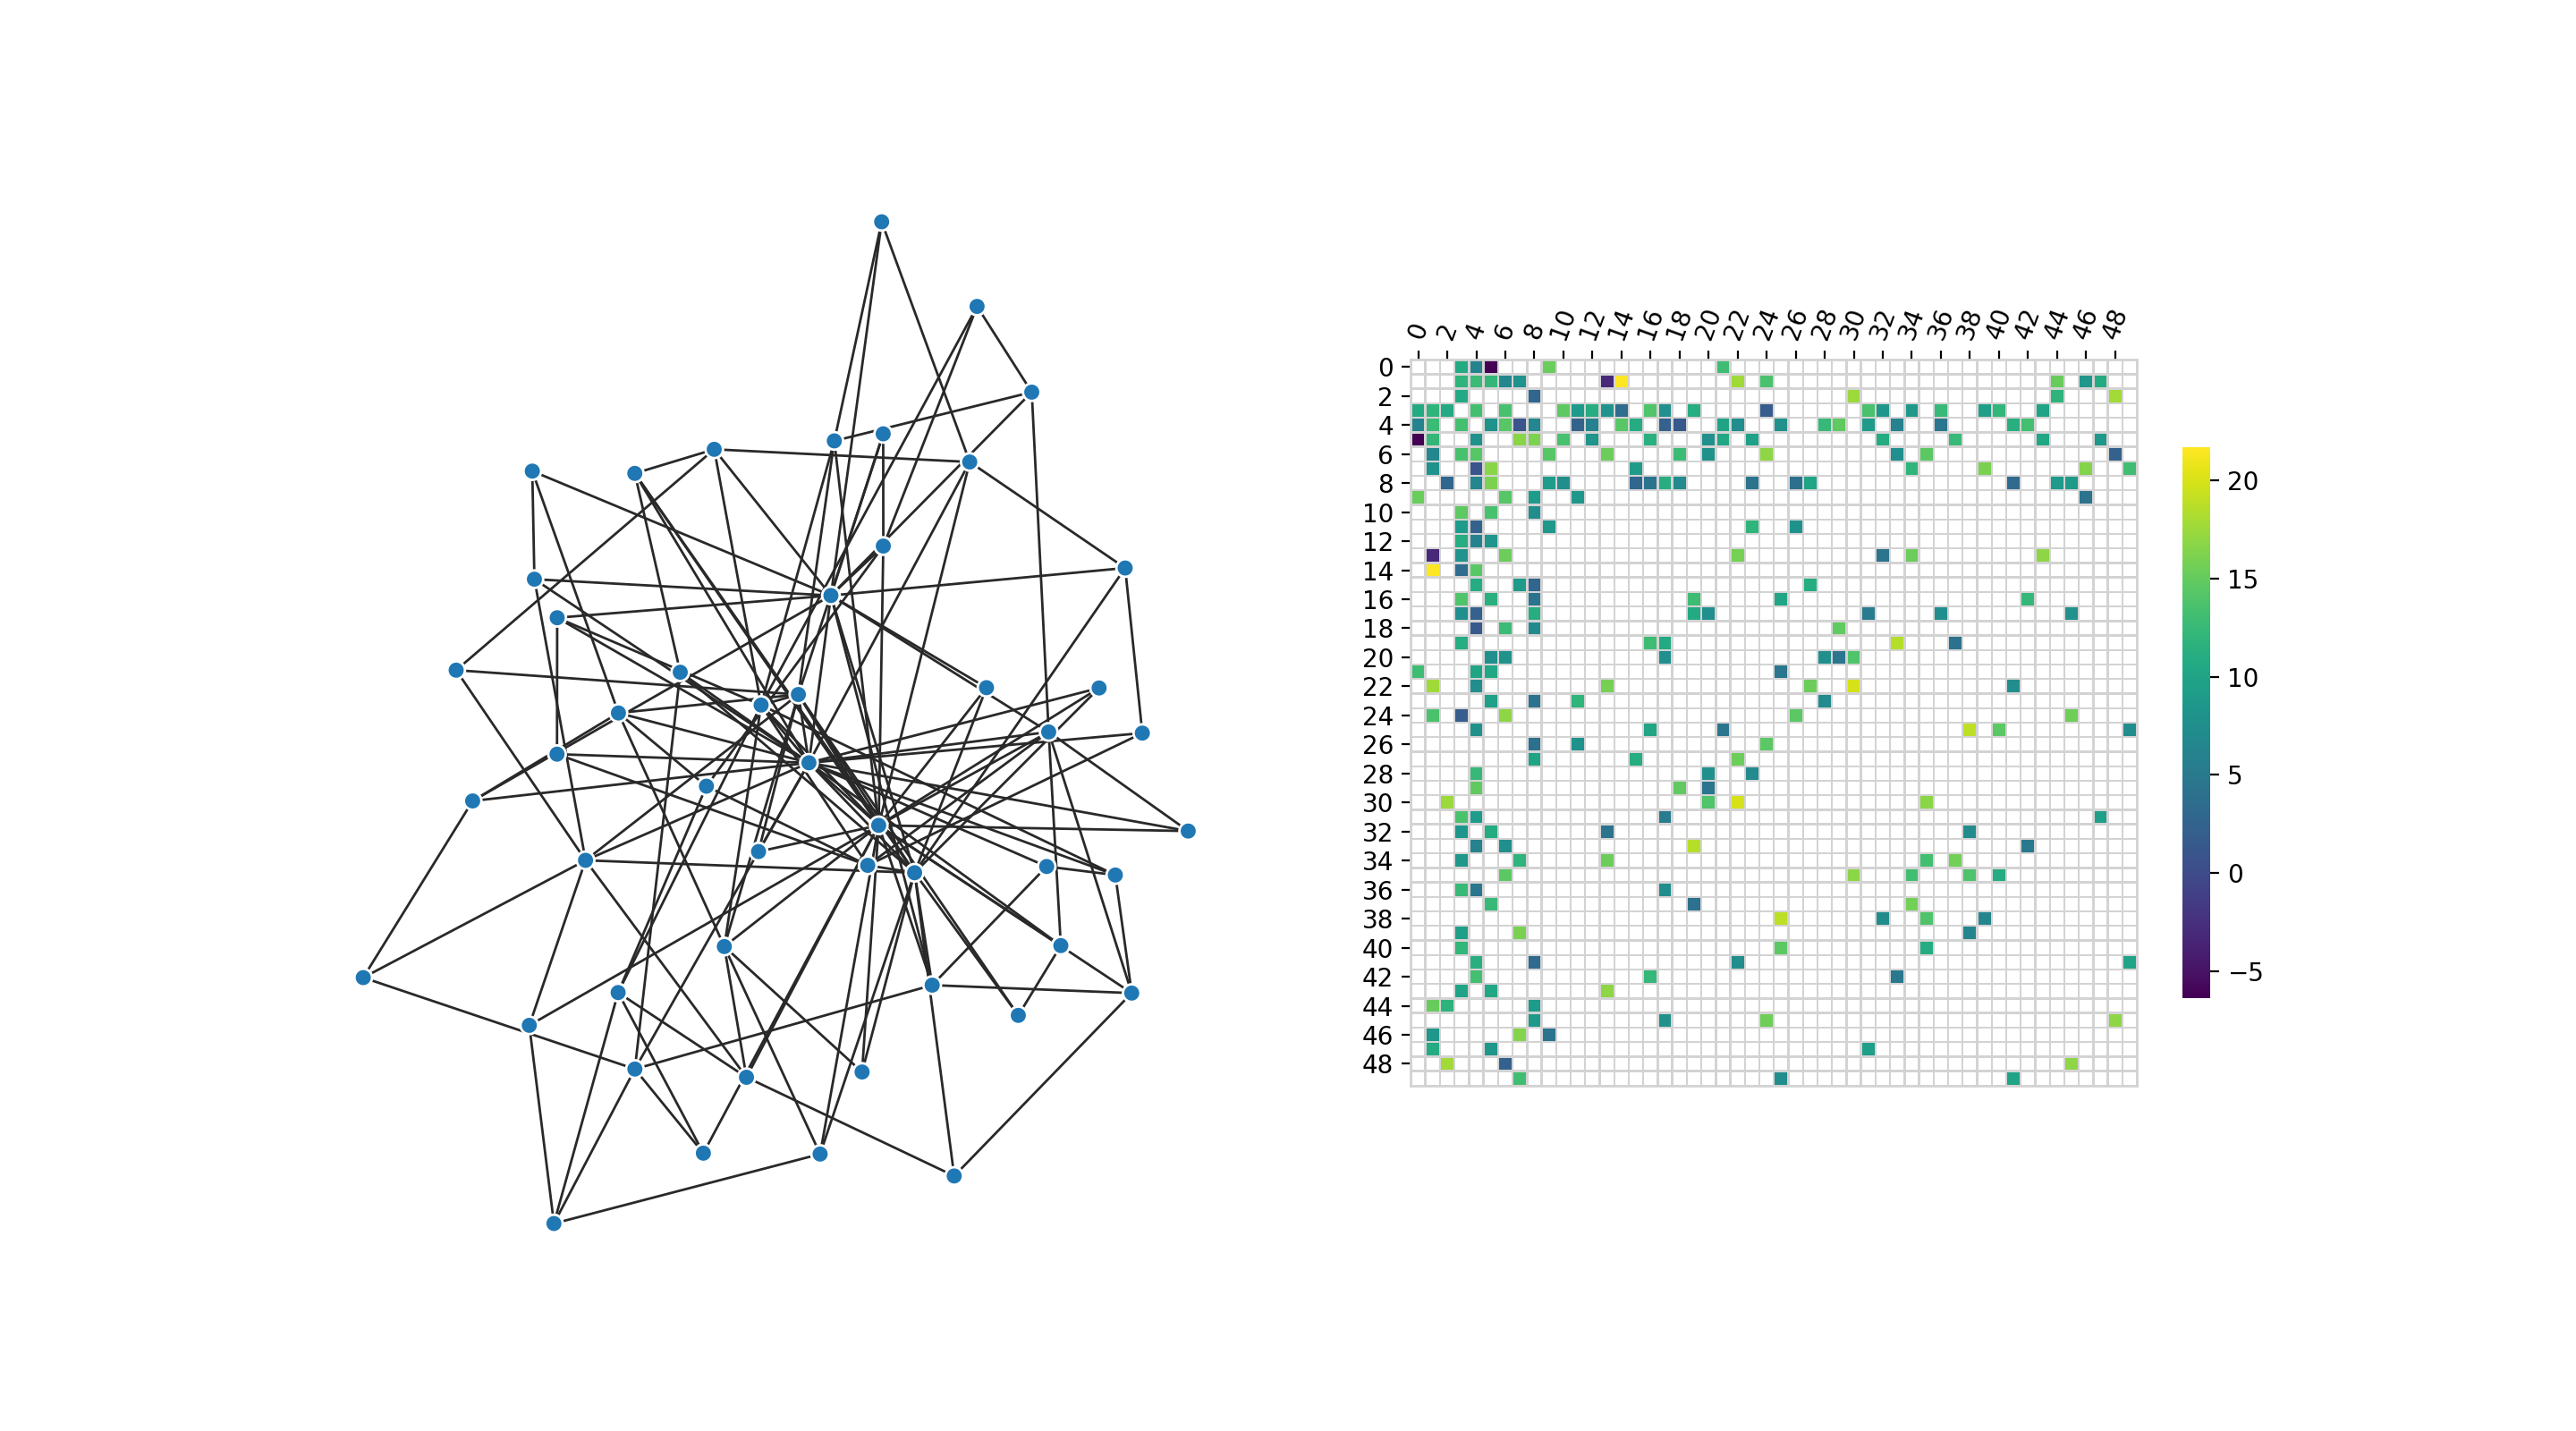
Currently supports weighted and unweighted adjacency matrices. For now, uses a seaborn heatmap. I've added a decorator for an optional dependency, and the function imports seaborn and pandas at function scope; this way, they don't have to have them installed, and will get a warning and return value of None if they call the function without them. Looking for thoughts on whether this is an antipattern, and general thoughts on the default style I've chosen.
Some example plots:
Regular adjacency matrix:

Weighted:
