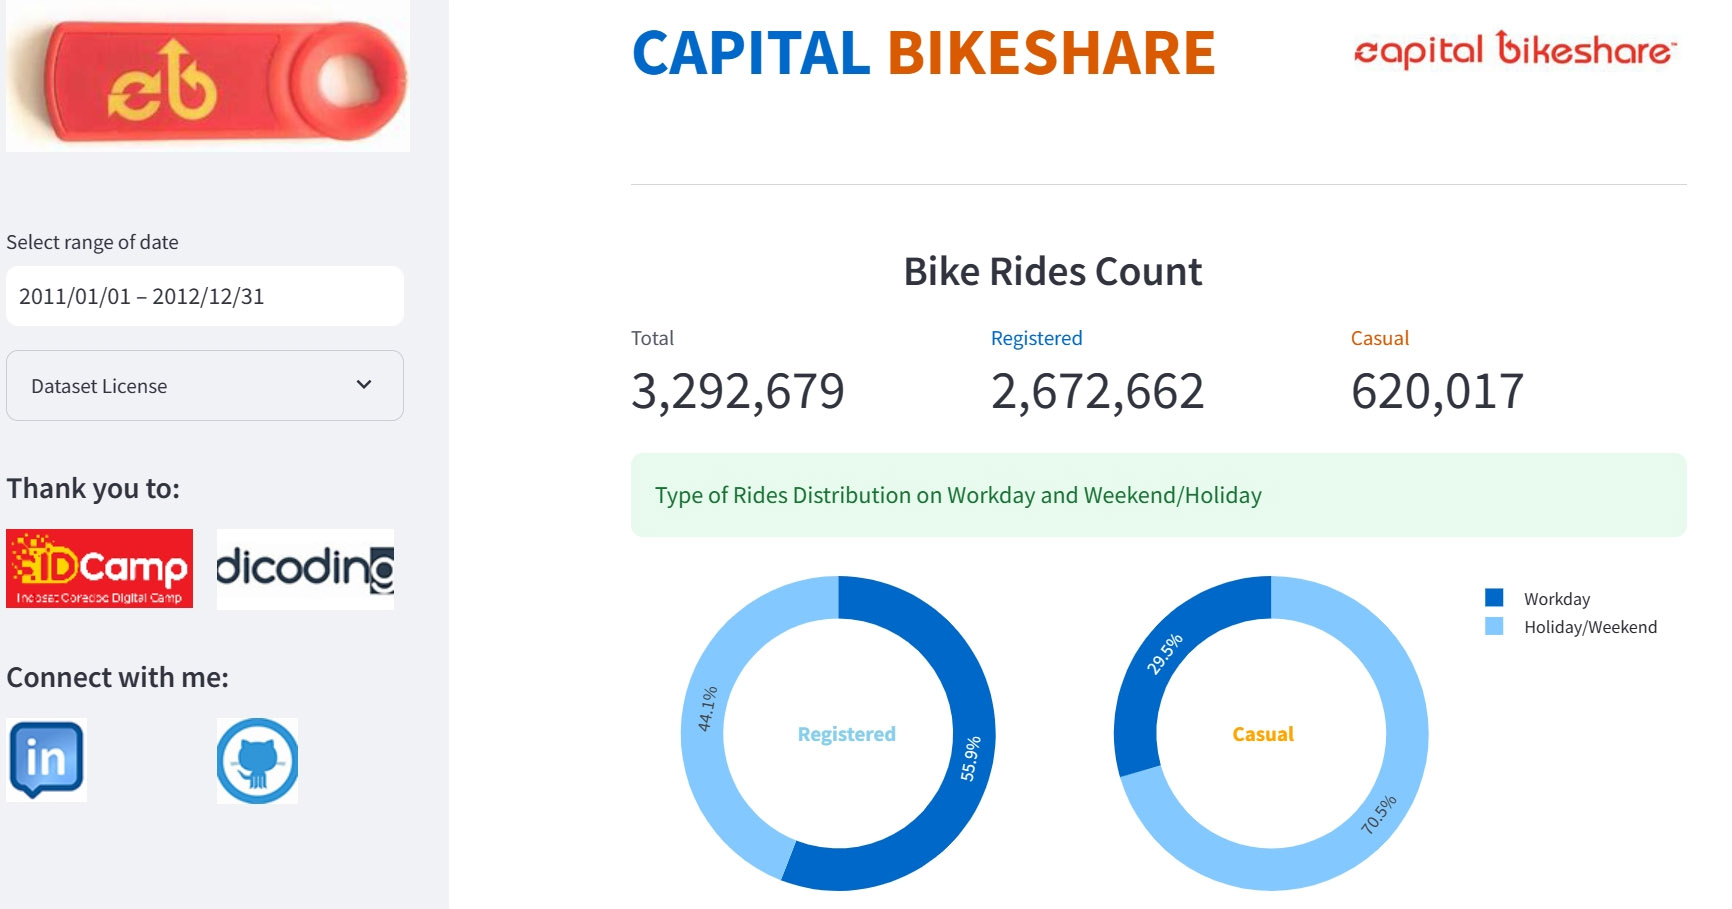
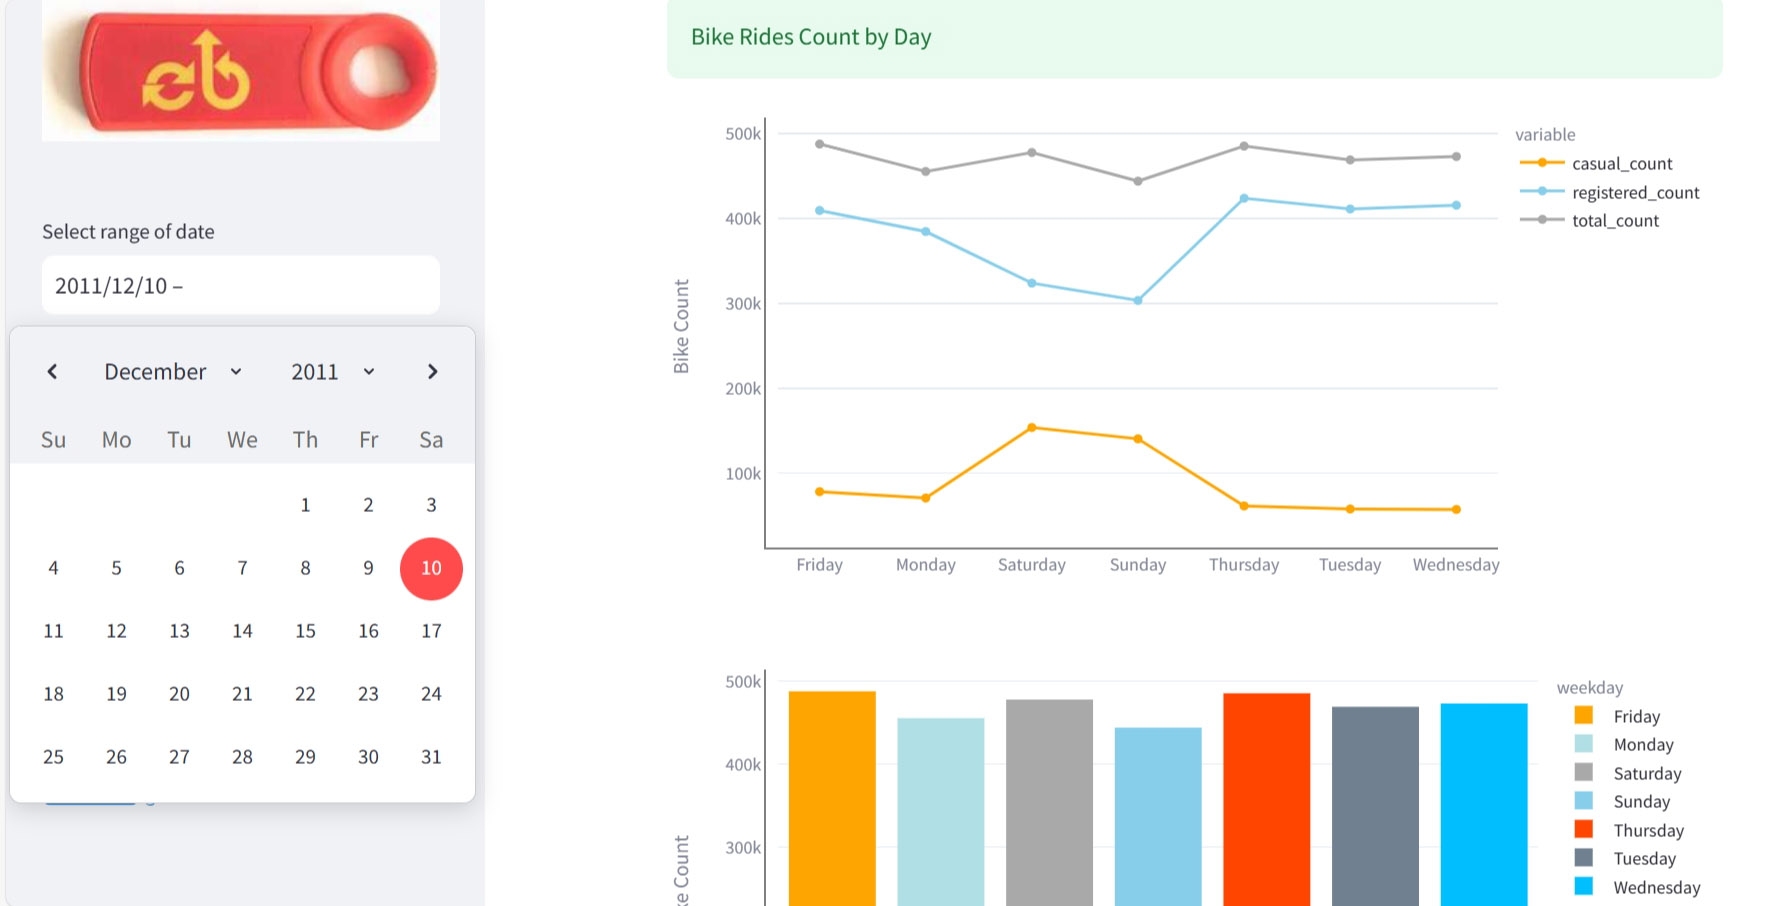
Image from https://capitalbikeshare.com/
Welcome to the README of Data Analysis Project: Capital Bikeshare System.
This repository uses the Capital Bikeshare dataset, available here. Weather information are extracted from here. The data for this repository is present within the DATASET folder downloaded from here.
This repository is developed as Final Assignment of Belajar Analisis Data dengan Python module, a part of Data Science learning path of Dicoding awarded by IDCamp 2023.
This repository is focusing on these following bulletpoints:
- Trend of bike rides over given years
- Peaks during time - monthly, weekly, hourly (most requested hour of the days)
- Casual riders vs Registered members, customer behaviour on usage of bikeshare
- Contribution of weather condition on bike demands
- Season wise hourly distribution of bike rentals
/assets: contains pictures which are used in this project/dashboard: contains the file bikeshare_dashboard.py which stores the functions needed by the dashboard/dataset: stores dataset used in this projectnotebook.ipynb: interactive jupyter notebook files to analyze dataREADME.md: file that provides information about this GitHub projectlicense.txt: file that maintain license of copy right of the dataset ownersrequirements.txt: file that stores information about the libraries used in this project
numpylibrary to carry out numerical computation such as sets, arrays, multidimension matrixes, and vectorspandaslibrary to undergo data processing, analysing, and manipulation.seabornlibrary to develop statistical data visualization based onmatplotlibmatplotliblibrary to perform visualization using plottingplotly.expresslibrary to perform interactive plottingstreamlitlibrary to develop interactive dashboard
notebook.ipynb
- Clone this Repository by running
git clone https://github.com/nickoaryad/IDCamp2023-Capital-Bikeshare.git. - Open Windows terminal or power shell.
- Run
pipenv installto install Python virtual environment. - Run
pipenv shell --fancyto activate the virtual environment. - Run
pip install -r requirements.txtto install all libraries. - Run
jupyter-notebookfrom shell open Jupyter Notebook. - Select
notebook.ipynb. - Connect to hosted runtime.
- Run the code cells.
/dashboard/dashboard.py
- Clone this repository by running
git clone https://github.com/nickoaryad/IDCamp2023-Capital-Bikeshare.git. - Open Windows terminal or power shell.
- Run
pip install streamlitto install Streamlit. - Run
pipenv installto install Python virtual environment. - Run
pipenv shell --fancyto activate the virtual environment. - Run
pip install -r requirements.txtto install all libraries. - Run
streamlit run dashboard.pyto execute the dashboard Python file.
Click to open dashboard application in Streamlit ➜ 
Copyright © Nicko Arya Dharma 2023 All Rights Reserved


