-
Notifications
You must be signed in to change notification settings - Fork 332
New issue
Have a question about this project? Sign up for a free GitHub account to open an issue and contact its maintainers and the community.
By clicking “Sign up for GitHub”, you agree to our terms of service and privacy statement. We’ll occasionally send you account related emails.
Already on GitHub? Sign in to your account
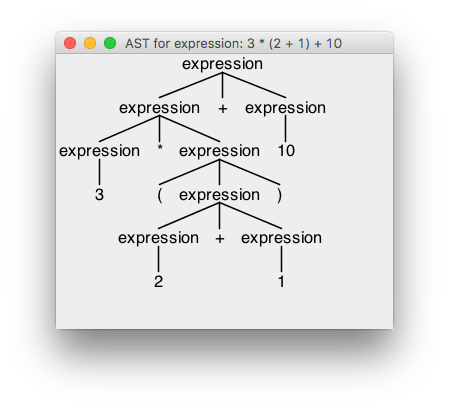
implement our own tree layout to avoid graphviz #1
Comments
|
oh great! Yeah, the tree layout is much better. will take a look. yeah, animl is cool name, shitty search keyword :( |
|
Actually the tree layout in graphviz uses an optimization procedure to
squish it as much as possible, leading to much more compact trees.
But that was kinda hard to implement.
For educational purposes the more obvious layout that I ~~copy and pasted~~
implemented might indeed be better though.
|
|
For my ANTLR work, I did my own tree layout (errr...donated cash to a smart German guy to do it) but it works very well; must be same algorithm. See treelayout Oh right. It uses Walker’s algorithm with enhancements suggested by Buchheim, Jünger, and Leipert. This layout is not limited to binary trees. Walker JQ II. A node-positioning algorithm for general trees. Software—Practice and Experience 1990; 20(7):685–705. Buchheim C, Jünger M, Leipert S. Drawing rooted trees in linear time. Software—Practice and Experience 2006; 36(6):651–665 |
|
Seems like @amueller's tree layout impl might be the answer to avoid DOT/graphviz altogether. I'll have to do my own node sizing based up importing SVG manually, but seems workable. |
|
The other approach is to use dot to compute the layout but generate our own SVG for the arrows (easy). To avoid graphviz trying to load svg (the problem we're trying to solve), we can fake it by describing a node with same viewbox as SVG file and just get the layout from graphviz, then generate our own SVG with embedded SVG nodes generated from matplotlib. |
Fix Booster import, remove try/exception

This might be relevant to your interests possibly:
scikit-learn/scikit-learn#9251
btw, animl is impossible to google ;)
The text was updated successfully, but these errors were encountered: