- Teaching notes from Data Organization in Spreadsheets for Ecologists
- Download the data
- These data are observations from a small mammal community in southern Arizon.
- The data come from a project studying the effects of rodents and ants on the plant community that has been running for almost forty years.
- The rodents are sampled on a series of 24 plots, with different experimental manipulations controlling which rodents are allowed to access which plots.
- This is a real dataset that has been used in over 100 publications.
- It has been simplified for this workshop.
- There are several spreadsheet programs available (some free and some not), including: Gnumeric, OpenOffice, LibreOffice, and Microsoft Excel. The commands differ slightly between different software, but he core concepts remain the same. If you don't already have a spreadsheet program installed on your computer, you can use LibreOffice for free. Instructions here.
- Create a folder on your desktop called
dc_workshopand move the downloaded data file (survey_data_spreadsheet_messy.xls) there.
Questions:
- What are the basic principles for using spreadsheets for good data organization?
Objectives:
-
Describe best practices for organizing data so computers can make the best use of that data.
-
Spreadsheets provide a useful graphical interface for designing data tables and handling basic quality control functions.
-
After this lesson, you will be able to...
- Implement best practices in data table formatting
- Identify and address common formatting mistakes
- Understand approaches for handing dates in spreadsheets
- Utilize basic quality control features
- Effectively export data from spreadsheet programs
Things we will talk about:
- Spreadsheets are great for data entry
- Not fun, but necessary
- This lesson will focus on effective ways to organize data so later analysis goes smoothly.
Things we won't talk about:
- How to do the following in spreadsheets
- statistics
- plotting
- writing code
- For this, check out Head First Excel, published by O-Reilly
Why not talk about these things?
-
Data analysis in spreadsheets usually requires a lot of manual work.
- Changing parameters or datasets requires you to redo work by hand
- It is difficult to reporoduce statistical or plotting analyses done in a spreadsheet when someone asks for details of your analysis (even with macros)
Excel versus other software
- Since most people use Excel, we will teach this lesson in Excel
- LibreOffice is a nice free alternative
- Commands differ between different software packages, but concepts remain largely the same
Exercise: Spreadsheets can be used for a lot of useful data activities:
- Data entry
- Organizing data
- Subsetting and sorting data
- Statistics
- Plotting
How have you used spreasheet programs in the past? What operations did you do? Discuss with your group.
Some problems with spreadsheets
- Creating tables for publications
- Summary tables provide key, summary statistics that are not meant to be read as data
- They involve special formatting
- We suggesting doing this sort of operation in whatever document editor you are using to write your publication
- Generating statistics and figures
- Spreadsheet programs have graphical interfaces
- This makes reproducing steps difficult
- Especially if you are working with someone else's spreadsheet
- It's easy to accidentally apply different formulas to adjacent cells
- When using command-line statistics programs like R, SAS, or Python, it's almost impossible to selectively apply a calculation to one datum and not another without doing so intentionally
Using Spreadsheets for Data Entry and Cleaning
- Remember: these are generic principles; spreadsheets are ubiquitous for a reason: they're useful.
- There will be times when you still use spreadsheets...even for the above-mentioned tasks.
- Maybe you need a quick summary
- You want to look at an initial figure
- We encourage you to think about how you use spreadsheets to be more effective in your data workflows.
- Use spreadsheets to complement the other data tools we will introduce in this workshop.
Questions:
- How do we format data in spreadsheets for effective data use?
Objectives:
-
Describe the best practices for data entry and formatting in spreadsheets.
-
Apply best practices to arrange variables and observations in a spreadsheet.
-
It is a common mistake to treat spreadsheets like a lab notebook, keeping notes in the margins.
-
This is (usually) helpful for humans, but not computers.
-
We want to organize spreadsheets in a manner that is useful for analysis on a computer.
-
It's important to think about the layout of your data tables before you even start entering data
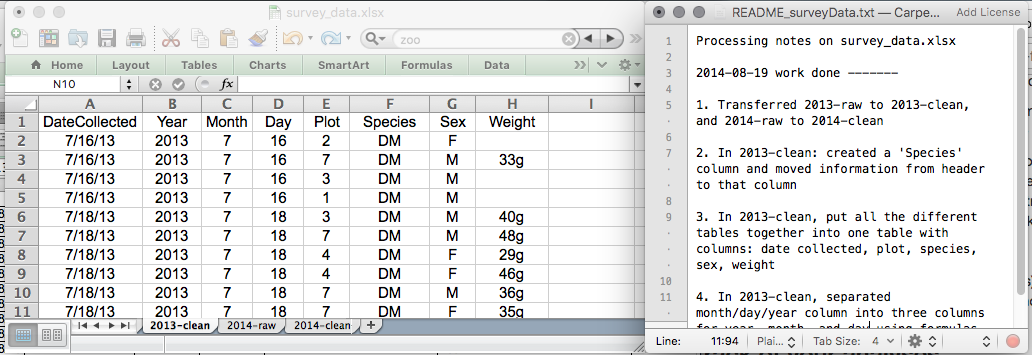
Keeping track of your analyses
- When working with data in a spreadsheet it is easy to end up with a spreadsheet that looks very different from the one you started with.
- Tracking your analyses:
- Create a separate file with cleaned or analyzed data
- Do not modify the original dataset or you won't know how you started
- Keep track of the steps you took in your cleanup or analysis
- We recommend using a separate plain-text file with a record of your steps that you save in the same folder as the data file.
Structuring data in spreadsheets
- Use tidy data principles when entering data in a spreadsheet
Hadley Wickham's paper on tidy data
- Tidy data principles:
- Put all your variables (the things you're measuring) in columns
- Put each observation in its own row
- Do not combine multiple pieces of information in one cell
- Sometimes items seem like one thing, but consider if that is the only way you will want to be able to sort that information
- Leave raw data raw
- Export cleaned data to a text-based format like
.csv(comma-separated values) files to ensure anyone can use the data
Example:
Not splitting atomic values

- Cannot sort by species
- Cannot run analyses like weight distribution by sex
Split atomic values

- Rule of thumb:
- columns = variables
- rows = observations
- cells = data (values)
Exercise: Open
survey_data_spreadsheet_messy.xlsin a spreadsheet program. There are two tabs where two field assistants conducted the surveys, one in 2013 and one in 2014. They both kept track of dats in their own way. Now you are the person in charge of this project and you want to start analyzing the data. Identify what is wrong with this apreadsheet. Discuss the steps you need to take to clean up the2013and2014tabs and put them in one spreadsheet. Do not forget: create a new file (or tab) for the cleaned data. Never modify your original (raw) data.
Questions:
- What are common challenges with formatting data in spreadsheets; how can we avoid them? Objectives: Recognize and resolve common spreadsheet formatting problems.
Common Spreadsheet Errors Intended to guide discussion for the above exercise.
Using multiple tables
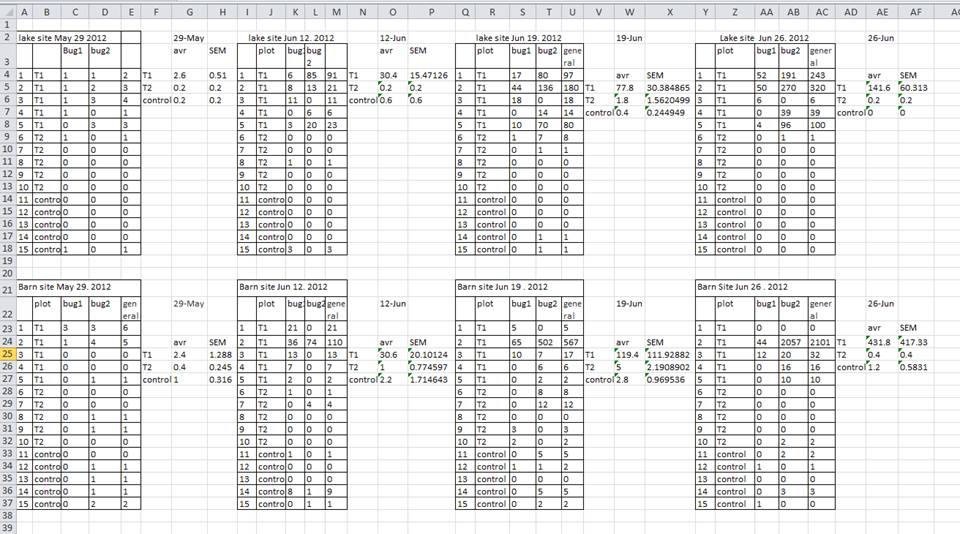
- The computer sees each row as an observation
- Multiple tables draw false associations between thing for the computer
- You potentially use the same field name in multiple places which makes it harder to claen up the data
Using multiple tabs
- Can be an asset when organizing like data, but comes with pitfalls:
- You are more likely to introduce inconsistencies when you can't reference other data in the sheet
- You will likely add a combine step in your workflow before you can run an analysis
- You will need to explicitly tell the computer how to combine data
- If formatting is inconsistent, you will have to do this work by hand (error prone)
- The computer does not draw connections between data automatically
- When starting a new tab, ask yourself if you can avoid adding the tab by adding another column instead
- Be careful not to mix column heading in with data; freeze column headings instead
Not filling in zeros
- If a column is mostly zeros, it's tempting to leave those cells blank
- The computer sees emtpy/null/not measured values as different from
0which is a datum - This can cause problems down the road with your analysis
- The average of a series of values containing a single null value is null
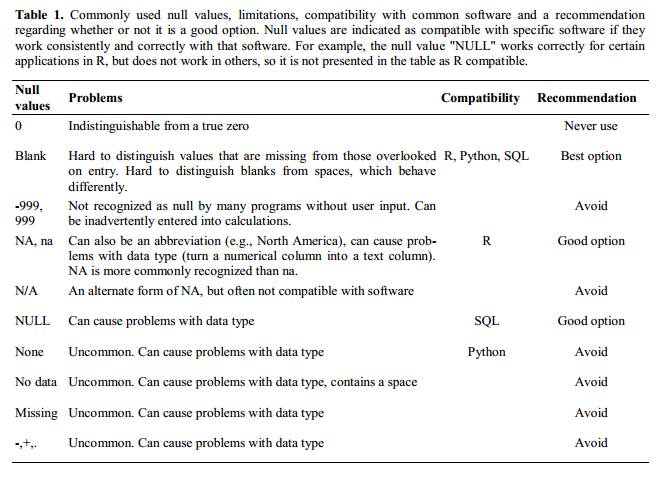
Using problematic null values
- There are many different conventions for representing null values
- Lab equipment sometimes uses numeric values like -999 to represent a null value
- Such conventions are particularly dangerous as they will likely be interpreted as numerical data by a computer
- Sometimes different null values are used within the same dataset to convey why a particular datum is missing
- This is encoding two pieces of differnt information in one column; consider adding a second column like
data_missinginstead - White et al, 2013 outline a table of differnt null values with their pros and cons
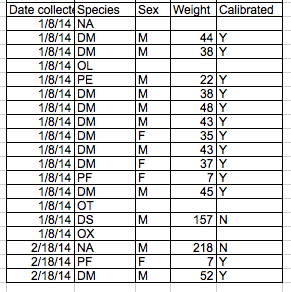
Using formatting to convey information
- Avoid highlighting cells to indicate whether or not data should be included in analysis
- Helpful for humans but not computers
- Avoid leaving blank rows to indicate separations in data
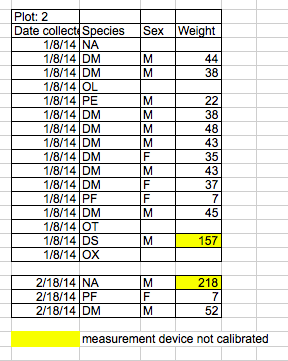
- Consider adding columns to encode extra information
Using formatting to make data sheets look pretty
- Merging cells can make data unreadable by statistical software; consider restructuring data to not need merged cells
Placing comments or units in cells
- Use a separate column for units (split atomic pieces of information)
- Consider adding another column if youGood Name Good Alternative Avoid Max_temp_C MaxTemp Maximum Temp (°C) Precipitation_mm Precipitation precmm Mean_year_growth MeanYearGrowth Mean growth/year sex sex M/F weight weight w. cell_type CellType Cell Type Observation_01 first_observation 1st Obsquires special consideration or is suspect
Placing more than one piece of information in a cell
- Split atomic values
Using problematic field names
- Use descriptive field names
- Don't include spaces, special characters, or numbers
- Such field names are often misinterpreted by statistical software
- Some parsers interpret whitespace as a delimiter
- Undersocres and camel case make good alternatives to spaces
- Abbreviations might not make sense later
- Including units in field names can help avoid confusion
| Good Name | Good Alternative | Avoid |
| Max_temp_C | MaxTemp | Maximum Temp (°C) |
| Precipitation_mm | Precipitation | precmm |
| Mean_year_growth | MeanYearGrowth | Mean growth/year |
| sex | sex | M/F |
| weight | weight | w. |
| cell_type | CellType | Cell Type |
| Observation_01 | first_observation | 1st Obs |
Using special characters in data
- It is not uncommon to paste notes into a spreadsheet from Word or an internet browser bringing along special characters
- These can be misinterpreted by statistical software or database software causing errors and erased data
- Treat cells like a webform: text and spaces only
Inclusion of metadata in data table
- Don't include a legend within the spreadsheet itself
- Recording metadata is important, but a spreadsheet should contain only the data itself
- Consider saving a
readme.txtfile in the same directory with information about units, folders within the directory, notes, etc.
Questions:
-
What are good approaches for handling dates in spreadsheets? Objectives:
-
Describe how dates are stored and formatted in spreadsheets.
-
Describe the advantages of alternative date formatting spreadsheets.
-
Demonstrate best practices for entering dates in spreadsheets.
-
Dates can be problematic in spreadsheet programs
-
How most spreadsheet programs display dates and store them are often different
-
Storage formats are often only compatable within the same suite of products
-
Excel will automatically turn items into dates (whether you intend it or not) that match certain formats
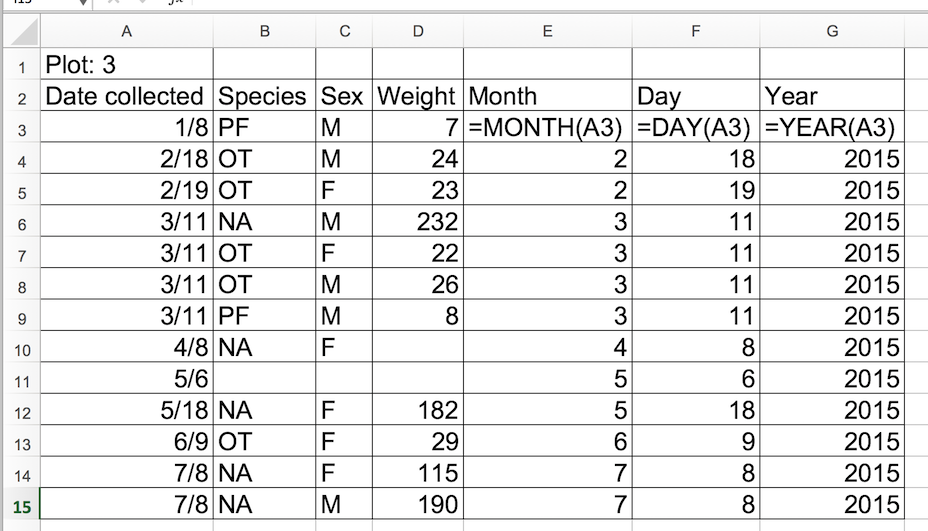
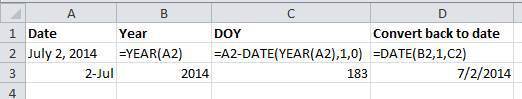
Exercise: Pulling out individual parts of dates.
- Create a tab called
datesin our spreadsheet and copy the "plot 3" table from the2014tab.- Extract month, day, and year from the dates in the
Date collectedcolumn into new columns. You can use the Excel functionsYEAR(),MONTH(), andDAY(). Make sure the new columns are formatted as a number and not as a date.The year is 2015 (even though we expected 2014). The field assistant who collected the data for year 2014 forgot to include their data for "plot 3" in the dataset. They came back in 2015 and added their data. Excel automatically interpreted the year as 2015 (the year the data was entered).
Exercise: Pulling hour, minute, and second out of the current time. Current time and ata are best retrieved using the functions
NOW()(current date and time) andTODAY()(current date).
Extract the year, month, and day from the current date and time string returned by
NOW().Calculate the current time using
NOW()-TODAY()Extract the hour, minutes, and second from the current time using the functions
HOUR(),MINUTE(), andSECOND().Press
F9to force the spreadsheet to recalculate theNOW()functions and check that it updated.
=YEAR(NOW()),=MONTH(NOW()),=DAY(NOW())
=NOW()-TODAY()will return a decimal value that is not human friendly (We see how Excel represents to the time internally). Use strategies from step three to get human-readable information.
=HOUR(NOW()-TODAY()), etc.
Preferred date format
- It is safer to break dates into their component parts (columns for YEAR, MONTH, DAY or YEAR and DAY-OF-YEAR)
- Excel is unable to parse dates before December 31, 1899. If you work with historical data, dates before this day will not be stored in its internal format leading to mixed data.
- Excel uses different internal formats for Windows and Macintosh versions (look for dates that approximately four year off)
Dates stored as integers
- Excel stores dates as a number (the number of days since December 31, 1899)
- The intention is to add convenience by allowing you to add and subtract dates
- This can be helpful, but be aware of the risks with this system
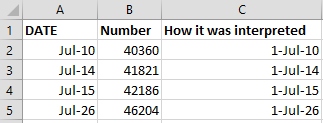
Exercise: What happens to the dates in the
datestab of our workbook if we save this sheet in Excel as a.csvfile and then open the file in a plain text editor (like TextEdit or Notepad)? What happens to the dates if we then open the.csvfile in Excel again?Dates display as month/day without any year information in the text editor. When we re-open the file in Excel, the dates show the current year, not 2015.
Storing dates as YEAR, MONTH, DAY
- We can create ambiguity within a spreadsheet by using YEAR-MONTH-DAY formatting
- The above spreadsheet represents insect counts that were taken every few days over the summer
- Did these counts happen in the future?
Some recommendations
-
Here are some possiblities to reduce ambiguity...
-
Store dates accross three different
year,month,dayfields and combine usingDATE()when need be. -
Use
YEAR,DAY-OF-YEARformatting- This is less ambiguous
- Most statistical modeles treat years as a categorical variable most of the time
Guide for creating YEAR, DAY-OF-YEAR formatted dates
-
Store dates as a single string
YYYYMMDDhhmmssMarch 24, 2015 17:25:35=20150324172435- Sorts correctly
- You set the encoding format instead of Excel and can ensure it is processed correctly by statistical software
Questions:
- How can we carry out basic quality control and quality assurance in spreadsheets?
Objectives:
-
Apply quality control techniques to identify errors in spreadsheets and limit incorrect data entry.
-
Once you have a well-formatted spreadsheet, you can implement technques to ensure you are entering accurate data
Quality Assurance
- You can prevent invalid data from being entered by using Data Validation
- e.g. If research is being conducted at sites A, B, and C, then V would be an invalid value for a
sitecolumn
- e.g. If research is being conducted at sites A, B, and C, then V would be an invalid value for a
- Open
surveys.csv - Select the cells or column you want to validate
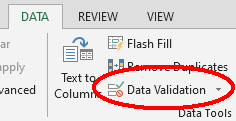
- On the
Datatab, selectData Validation
- In the
Allowbox, select the kind of data that should be in the column
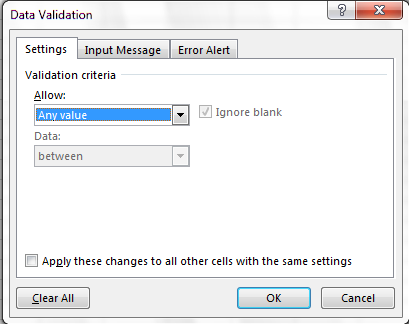
- After selecting an item enter any additional details. For example, if you’ve chosen a list of values, enter a comma-delimited list of allowable values in the
Sourcebox
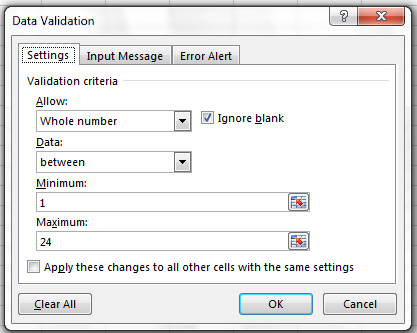
- Let's do this on our spreadsheet. Only allow the plot column to contain integers between 1 and 24.
- Select the
plot_idcolumn - On the
Datatab selectData Validation - In the
Allowbox select "Whole number" - Set the minimum and maximum values to 1 and 24
- Try entering a new value in the plot column that isn't valid
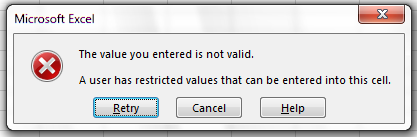
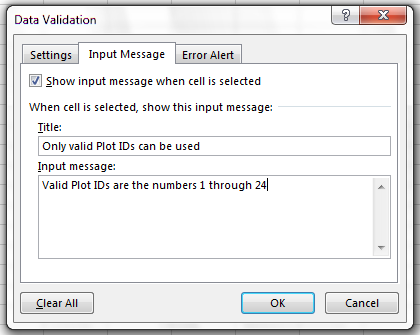
- You can customize this message in the Data Validation
Input Messagetab
- You can change the error to a warning in the
Styleoption in theError Alerttab
- If you limit entry to a list of items, the spreadsheet will provide a dropdown, making data entry easier
Quality control
- Don't forget to keep the original data pristine and create a
readme.txtfile - Helpful resource: Cornell University's guidance on creating
readme.txtfiles
Sorting
- Invalid values often sort to the bottom or top of a column
- e.g. If your values should be numerical, alphabetical and null data will group at the ends of the sorted column
- Sort the data on each column one at a time to root out poor data
- Don't forget to expand your sort in order to prevent data corruption!
Conditional formatting
- Use with caution
- Can be a good strategy for flagging outliers
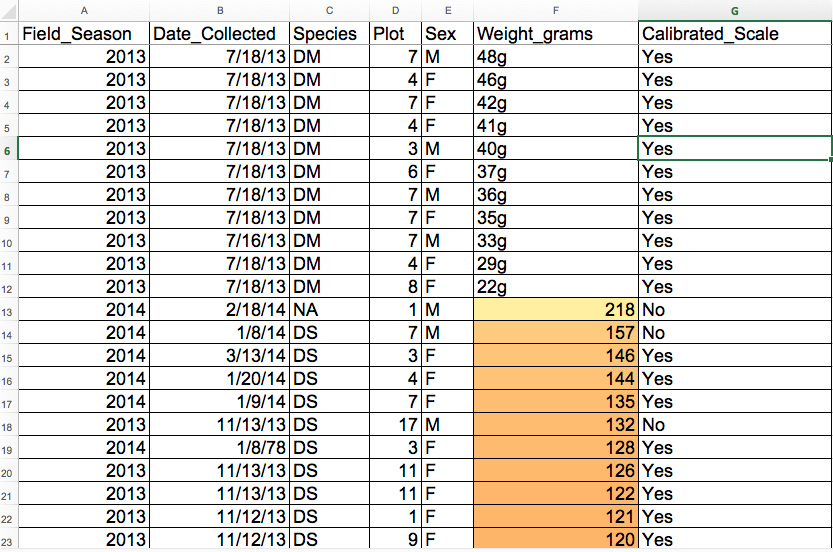
- Open
surveys.csv- Highlight the
hindfoot_length- Click
Home>Conditional Formating...and choose a formatting rule- LibreOffice: Format > Conditional > Condition
- Apply any
2-Color Scaleformatting rule- Do you notice any strange values?
Questions:
- How can we export data from spreadsheets in a way that is useful for downstream applications?
Objectives:
- Store spreadsheet data in universal file formats.
- Export data from a spreadsheet to a
.csvfile.
Storing data using native formats is problematic
- We do not recommend using
.xls,.xlsx(Excel), or.ods(LibreOffice) file formats. - Since these formats are proprietary it is possible future technology to read these formats will become rare or cease to exist
- Other spreadsheet software may not be able to read the file
- Different versions may handle data differently
- More and more journals and grant agencies are requiring researchers to deposit data in a data repository (most of them do not accept Excel formats)
- Excel handles dates differently across different versions of the software
- Storing data in universal, open, and static formats keeps data consistent and reduces the possibility of error
- Possible formats:
- tab-delimited (
.tsv)- Great option when the data itself has commas
- comma-delimited (
.csv)
- tab-delimited (
- Most software recognizes these formats
- They are easily imported and interpreted in different environments
- The encoding is simple, so they will continue to be interpretable into the future
- These formats work well with version-control software like Git
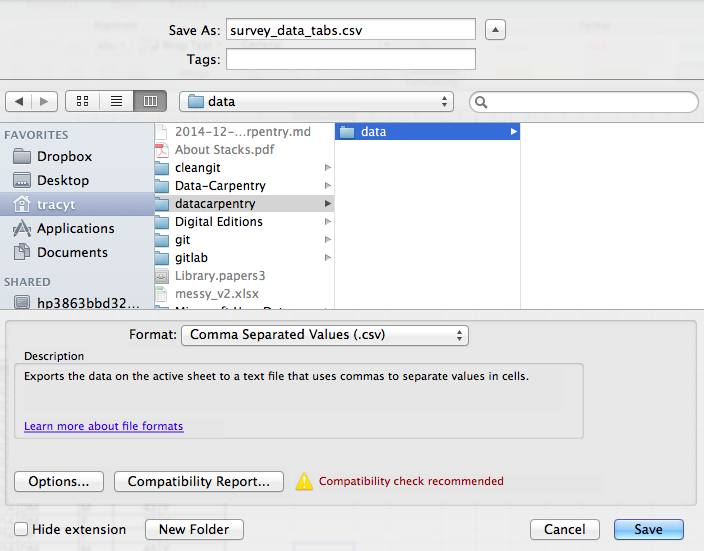
To save a file in Excel in
.csvformat...
- Select
File>Save as- In the
Formatfield, selectComma Separated Values (*.csv)- Select the location and click
Save.