
Simple python implementation of the Temporal Outlier Factor [1] (TOF) anomaly detection method.
Install it directly from PyPI:
pip install uniqedThis is a simple example:
from uniqed.data.gen_logmap import generate_logmapdata
from uniqed.runners.tof_run import detect_outlier
import matplotlib.pyplot as plt

# Generate some data
data_df = generate_logmapdata(rseed=359)

# Detect outliers
res_df = detect_outlier(data_df[['value']], cutoff_n=80)


# plot the results
fig, axs = plt.subplots(2, 1, sharex=True)
fig.suptitle('TOF anomaly detection demo')

axs[0].plot(res_df['value'], color='tab:blue', label='time series')
axs[0].plot(res_df['value'].loc[data_df.query("is_anomaly==1").index.values],
         color='tab:green', label='anomaly')
axs[0].plot(res_df.query("TOF==1")['value'], lw=0, marker='o',
         color='tab:orange', label='TOF detections')
axs[0].set_ylabel('values')
axs[0].legend(loc='upper left', framealpha=1)


axs[1].plot(res_df['TOF_score'], color='k', label='TOF score')
axs[1].plot(res_df['TOF_score'].loc[data_df.query("is_anomaly==1").index.values],
         color='tab:green', label='anomaly')
axs[1].plot(res_df.query("TOF==1")['TOF_score'], lw=0, marker='o',
         color='tab:orange', label='TOF')
axs[1].set_ylabel('TOF score')
axs[1].set_xlabel('t')
axs[1].legend(['TOF score', 'anomaly', 'TOF detections'],
              loc='upper left',
              framealpha=1)

axs[1].set_xlim(0, 2000)
axs[0].grid(True)
axs[1].grid(True)

fig.tight_layout(rect=[0, 0, 1, 1], pad=1, h_pad=0, w_pad=0)
fig.savefig("example_run.png")
plt.show()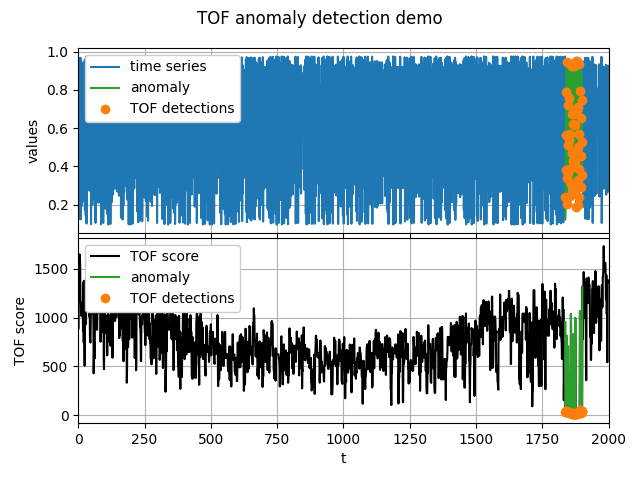
| [1] | Benkő, Z., Bábel, T., & Somogyvári, Z. (2020). How to find a unicorn: a novel model-free, unsupervised anomaly detection method for time series. http://arxiv.org/abs/2004.11468 |