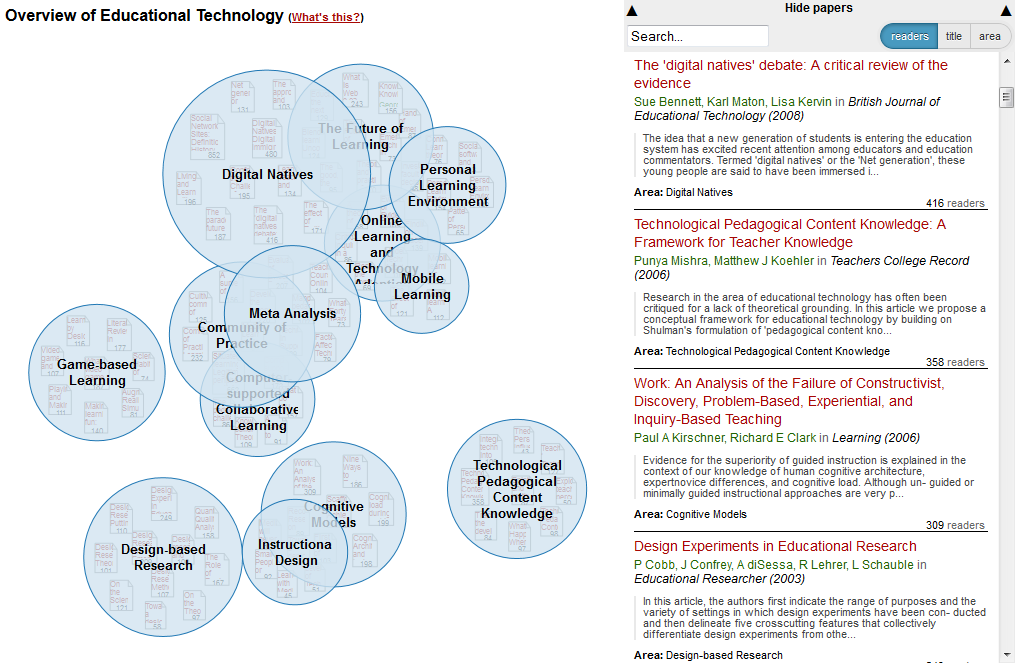
Head Start presents you with the main areas in the field, and lets you zoom into the most important publications within each area. It is intended to give researchers that are new to a field a head start on their literature review (hence the name).
Peter Kraker (peter.kraker@tugraz.at)
Philipp Weißensteiner (philipp.weissensteiner@student.tugraz.at)
- The main areas in the field are represented by the blue bubbles.
- Once you click on a bubble, you are presented with the main papers in that area.
- The dropdown on the right displays the same data in list form. By clicking on one of the papers, you can access all metadata for that paper.
- If a preview is available, you can retrieve it by clicking on the thumbnail in the metadata panel.
- By clicking on the white background, you can then zoom out and inspect another area.
- To access the an overview over time, click on TimeLineView.
The visualization was created with D3.js. It has been successfully tested with Chrome 22, Firefox 15, and Safari 5.1. Unfortunately, Internet Explorer is not supported at this point due to the fact that it is not possible to insert HTML into a foreignObject.
- Mendeley Labs. A working prototype for the field of educational technology that includes paper previews.
- Conference Navigator 3 [registration required]. An adaptation of Head Start for the conference scheduling system CN3. This version enables users to schedule papers directly from the visualization. Scheduled papers and recommended papers are highlighted.
- Organic Edunet portal. Overview of recommended resources in the Organic Eudnet portal.
The visualization is based on readership co-occurrence in Mendeley. More information can be found in the following papers:
Kraker, P., Schlögl, C. , Jack, K. & Lindstaedt, S. (2015). Visualization of Co-Readership Patterns from an Online Reference Management System. Journal of Informetrics, 9(1), 169–182. doi:10.1016/j.joi.2014.12.003
Kraker, P., Weißensteiner, P., & Brusilovsky, P. (2014). Altmetrics-based Visualizations Depicting the Evolution of a Knowledge Domain. In 19th International Conference on Science and Technology Indicators (pp. 330–333).
Kraker, P., Körner, C., Jack, K., & Granitzer, M. (2012). Harnessing User Library Statistics for Research Evaluation and Knowledge Domain Visualization. Proceedings of the 21st International Conference Companion on World Wide Web (pp. 1017–1024). Lyon: ACM. doi:10.1145/2187980.2188236
An earlier version of the code can be found on knowminer.at
To get the application running locally you can use the included ruby/server.rb.
$ ruby server
should start a server at http://localhost:8000/.
Head Start is licensed under LGPL v3.
If you use Head Start in your research, please cite it as follows:
Kraker, Peter; Weißensteiner, Philipp (2014): Head Start. figshare. http://dx.doi.org/10.6084/m9.figshare.1091372
