Takes excel file output from qPCR machine, sample names layout and optional standard curve parameters. Plots Cq data, absolute concentrations and Tms in a neat format, ~ almost ready for publication.
- Code works with .xlsx file output by
Applied Biosystems Quantstudio-3) - If you need to analyze data from other instruments and if the current code fails, export to RDML format and use the script
linregpcr_processing.R
standard curve : Include Stdxx (xx = numbering) in the excel file name to process data and make a standard curve using data within the file
If you're wondering that you can do all this with your expert excel skills, here's my rationale to convince you: Coding this trivial analysis and plotting is very useful because I run tons of qPCR and I want all the plots to have the same formatting for easy comparision of data between runs without clicking around for every analysis. I wouldn't want to plot all these on excel! The script is especially handy when I run some experiment in a hurry for a meeting and I can get something to show in 2 mins by running the script 😂
- Clone the respository using git onto your computer. This brings in the code files and also mimics the folder structure (check if all the necessary folders are present)
- Open the scripts in R by clicking on the
qPCR analysis.Rprojfile. _This ensures that R's current working directory is at the base of this project.- If you haven't you need to install R, Rstudio, git; and install the packages listed with the library commands in
0-general_functions_main.Rscript usinginstall.packages('..')_
- If you haven't you need to install R, Rstudio, git; and install the packages listed with the library commands in
- Set metadata sheets: Default option is to add your plate layout in the
excel files/Plate layout.xlsxfile. Make sure thetemplate_sourcevariable is set to 'excel' in0.5-user-inputs.Rfile.- If you would prefer a cloud option, then make a googlesheet with sheets named
qPCR plate layoutsandqPCR Std curvesfollowing the template from my sheet - Copy the url of your googlesheet and replace the one in
sheeturls = list(plate_layouts_PK = ..in the script0-general_functions_main.R
- If you would prefer a cloud option, then make a googlesheet with sheets named
- Enter your sample name details into the
Plate layoutssheet in a format of your choice (excel / googlesheets) - Open
0.5-user-inputs.Rscript. Change only theflnmvariable (for simple runs). and other options by following the comments in the file - You can try running the template file
q50_S080_RAM 80a_mjd61 repression_new barcodewithin theexcel files/folder. Metadata for this is provided in thePlate layouts.xlsxsheet in the same folder, and this should be read by changing thetemplate_source <-to'excel'in the user settings file0.5-user_inputs.R. _Side note: I read this from a google sheet that enables me to setup qPCRs by looking at this sheet on my phone :). Here is my google sheet with the metadata. - Open
analysis.Rscript and source it to analyze the data.
Sample naming scheme
Sample names are written in a google sheet (contact me for access to see the template) in this particular format
targetname_samplecategory_templatename with an optional _biologicalreplicatenumber in the end
- targetname = name of the amplicon, ex: 16S, U64, spliced. _When plotting, each target is shown in a separate facet using
facet_grid() - samplecategory could stand for test, positive, negative (controls) or NoRT control etc. This will be used to colour data in the plot
- templatename = name of the DNA or RNA sample loaded as the template. this appears on the x/y axes of the plot
- biologicalreplicatenumber = 1,2,3 .. If not provided, the code makes it in a rowwise order. This is useful to plot all replicates in the same template location and plot averages of the replicates
Examples: 16S_negative_MG1655 or 16S_Maximal_AOS109

The output image looks like this
targetnamebecomes facets or panels (boxes on the top);- samplecategory as colour (named as
Sample_name) templatenameon the x axis (namedassay_variablein the code) and

Code organization
- main branch holds the latest version of the code for general purpose plotting for any qPCR output file with sample names in the above way
- For customized plots for individual experiments, you can process the data with the regular script and then code custom
.Rscripts to rename data and re-plot the data in your own way. Scripts of this kind that I used for my experiments are in theadhoc_scripts/folder. - The main
Linregpcr tool analyzes raw qPCR curves and calculates the ~initial fluorescence which can be converted into initial concentration using calibration standards (6 replicates of the same concentration known standard). I have made a wrapper to run their python version of LinRegPCR through R, but the portability and documentation is in progress.
If you want to try it out, the script is called linregpcr_processing.R

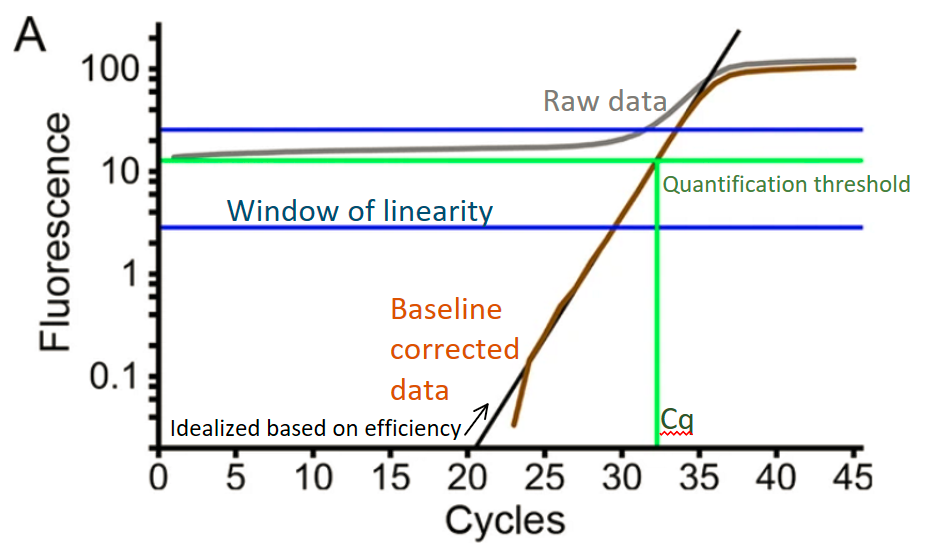
Summary: The linregPCR method is more robust and open source compared to proprietary methods used by vendor software. This works with curves that have a reasonable baseline and plateau region with good plateau intensity above baseline. This could be problematic for probe based data, or samples with very high (ex: 16S) or very low quantifications, so iterate and decide for yourself if this is right for you.
- LinRegPCR outputs both efficiency and Cq values which are used for quantification. Absolute quantification can be done using calibration with a single concentration of known concentration sample x 6 replicates
Source: Untergasser, Andreas, et al. "Web-based LinRegPCR: Application for the visualization and analysis of (RT)-qPCR amplification and melting data." BMC bioinformatics 22.1 (2021): 1-18.).
wrappers for automated processing and plotting of bacterial flow cytometry data
Copyright (C) 2023  Prashant Kalvapalle

This program is free software: you can redistribute it and/or modify
it under the terms of the GNU General Public License as published by
the Free Software Foundation, either version 3 of the License, or
(at your option) any later version.

This program is distributed in the hope that it will be useful,
but WITHOUT ANY WARRANTY; without even the implied warranty of
MERCHANTABILITY or FITNESS FOR A PARTICULAR PURPOSE.  See the
GNU General Public License for more details.

You should have received a copy of the GNU General Public License
along with this program.  If not, see <http://www.gnu.org/licenses/>.