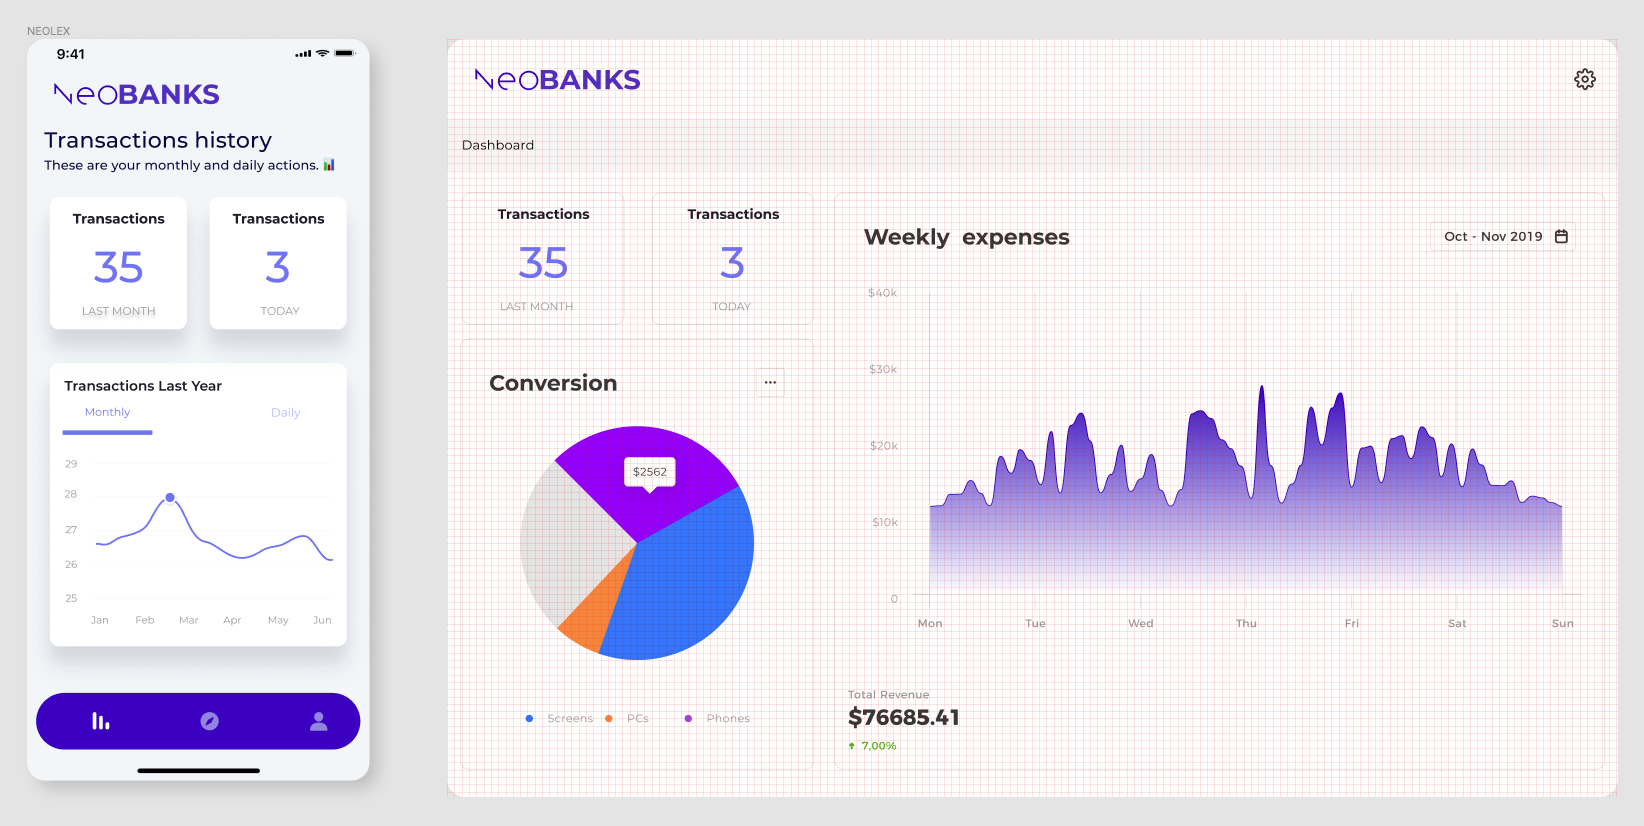
This is my response to the Nuwe & CaixaBank Tech challenge. The objective is to build a mobile & web cross platform in React, following the design given in Figma
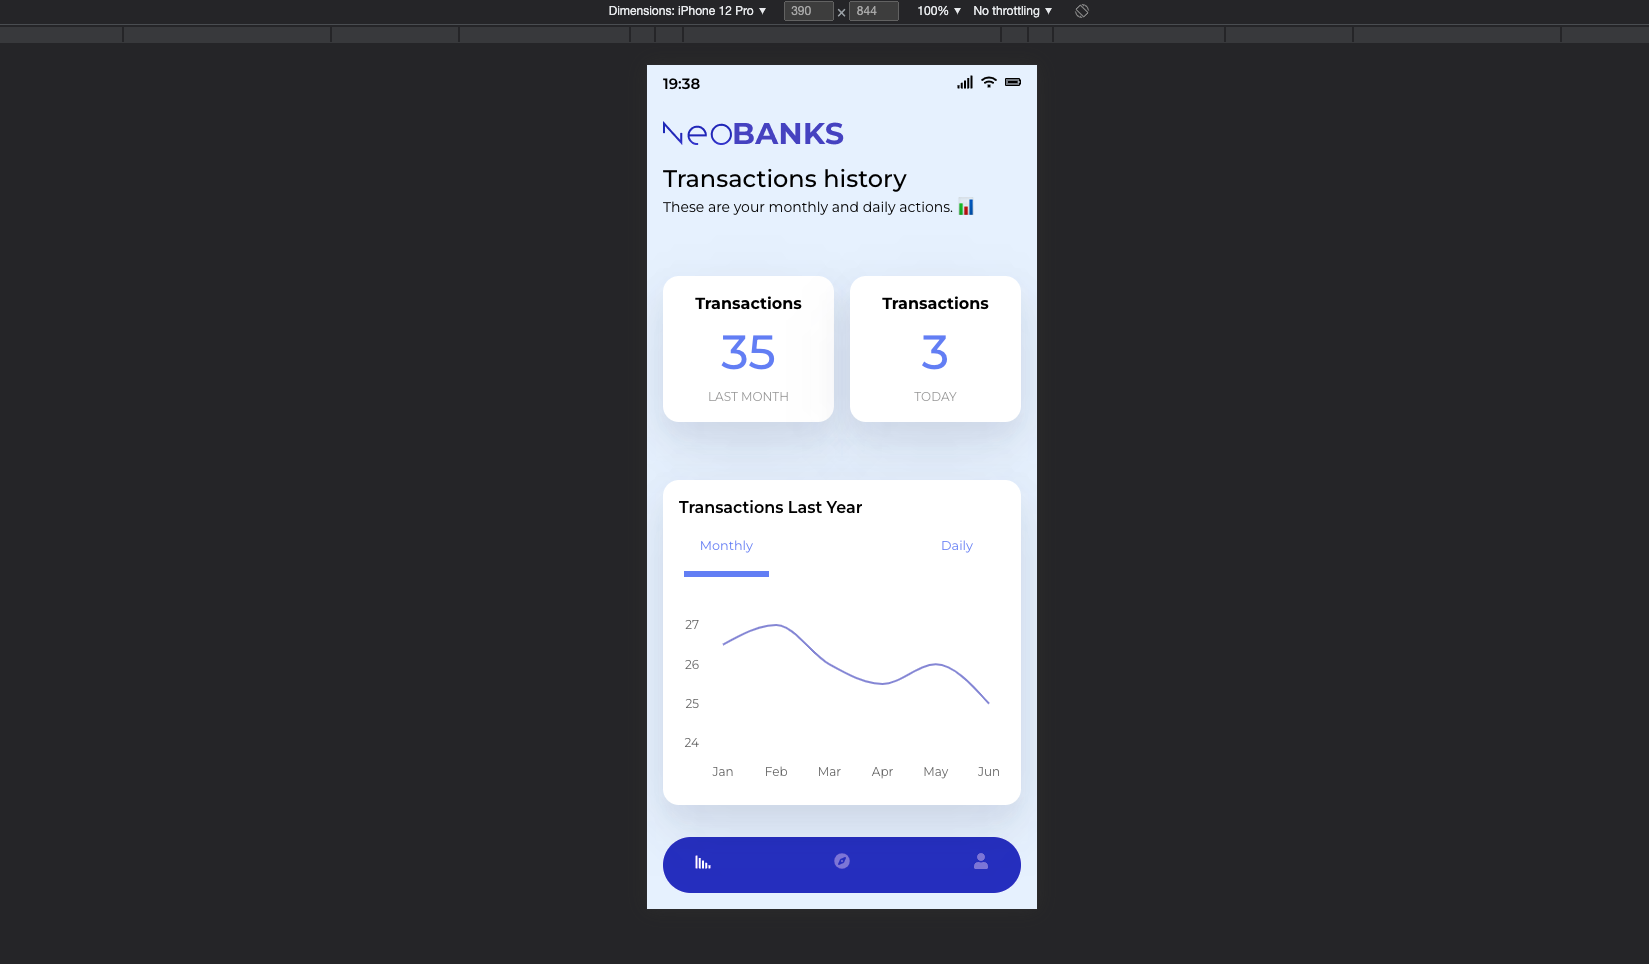
We should build the components for a mobile web app and for a dashboard. So far I've been able to build the web app using ReactJS, Typescript, and Recharts, a React composable charting library for the graphics.
Clone this repo, cd into newly created dir and install dependencies
git clone git@github.com:pyrenaicus/neobanks.git
cd neobanks
yarn
If you want to follow all the steps to build it from scratch, do:
- Create a React app with Typescript template:
npx create-react-app neobanks --template typescript- Install Recharts library:
yarn add recharts- You will need as well to install react-icons
yarn add react-iconsYou can see a live demo here: neobank.surge.sh
To build the app I followed an Atomic design methodology. Using this approach allows us to break our components into smaller units that can be developed and tested in isolation, and it helps to keep our directories in order as things scale up.
├── components
│   ├── atoms
│   │   ├── IconBarchart.tsx
│   │   ├── IconBattery.tsx
│   │   ├── IconCompass.tsx
│   │   ├── IconSignal.tsx
│   │   ├── IconUser.tsx
│   │   ├── IconWifi.tsx
│   │   └── Time.tsx
│   ├── molecules
│   │   ├── AppHeader.tsx
│   │   ├── PhoneStatus.tsx
│   │   └── PhoneVitals.tsx
│   └── organisms
│       ├── InfoBox.tsx
│       ├── MainSection.tsx
│       ├── MenuBar.tsx
│       ├── SectionHeader.tsx
│       ├── TransactionsGraphic.tsx
│       └── TransactionsInfo.tsx
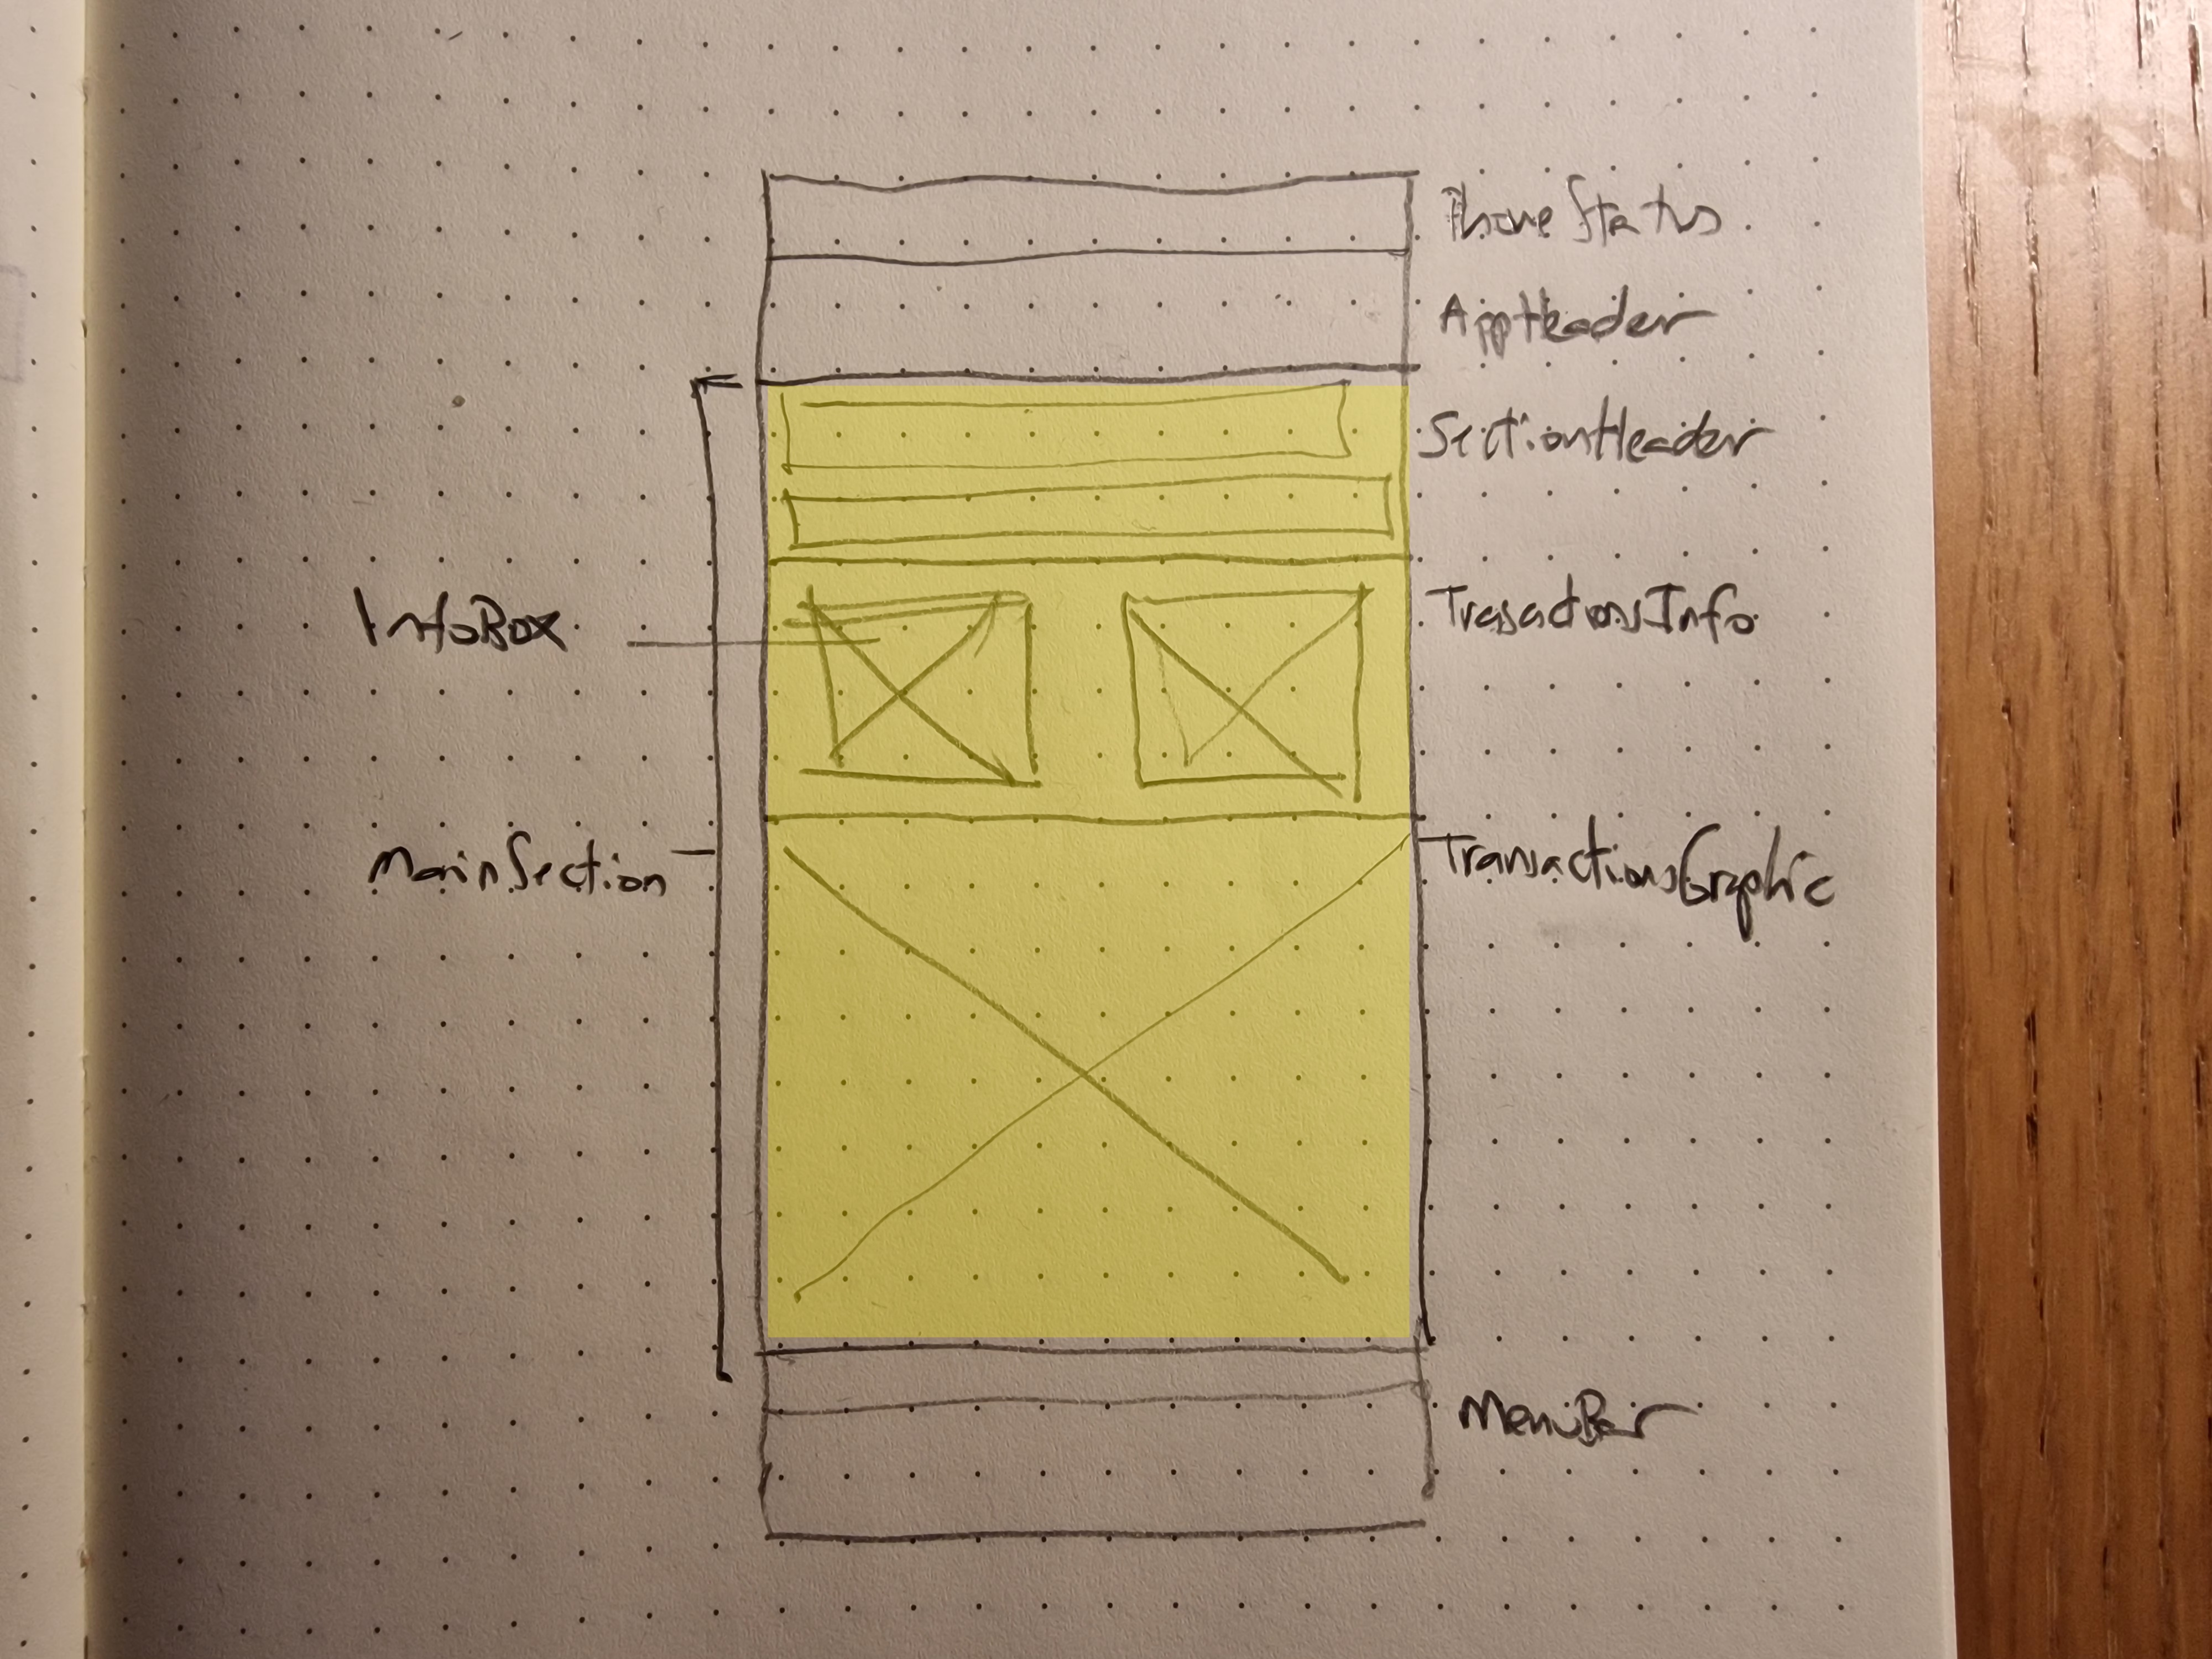
Roughly, the app is composed by a series of components, a PhoneStatus on top showing on one side current time, and on the other a series of phone vitals, Time and PhoneVitals components.
Below PhoneStatus is an AppHeadercomponent, and in the bottom we find the MenuBar component.
In between them we find the MainSection component, it holds what we could say all the data-driven components of the app.
Right now is a mockup, and we are passing hardcoded data by props to the components.
A SectionHeader component showing a headline and a subheadline.
Below it a TransactionsInfo component, holding two InfoBox components.
And right below it, TransactionsGraphic, the largest component, holding a line chart built with Recharts and showing a view of transactions over time, with tabbed views.
This project is licensed under the MIT License


