Analysis
BinaRena can calculate several metrics to evaluate the goodness of bins as the user manipulates them in the interface.
BinaRena can evaluate the confidence of binning by calculating the silhouette coefficient. Specifically, a silhouette coefficient measures how similar a contig is to other contigs in the same bin, as in contrast to contigs in other bins. It ranges from -1 (worst) to 1 (best).
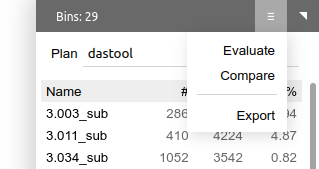
The function can be triggered by selecting "Evaluate" in the dropdown menu of the bin panel.
It allows the user to select variables to be included in the calculation.
- Note: Only select variables that are presumably homogeneous in each bin (e.g., GC%, coverage, k-mer frequency). Don't select those that aren't (e.g., length of contig).
Then click "Calculate" to start calculation. When done, the mean silhouette coefficient of each bin and all bins will be displayed in a table.
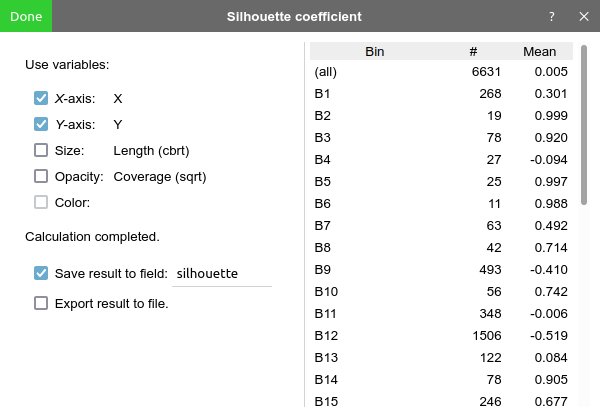
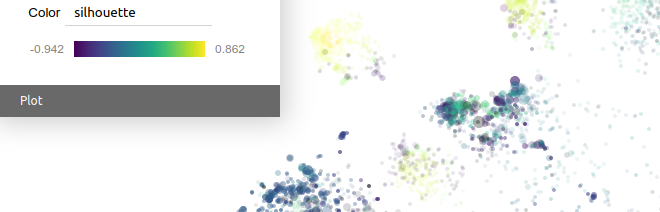
Before pressing "done", one may check "save result to field" to save the calculated silhouette coefficient to a categorical field. BinaRena will automatically color the contigs using these values, from which one can immediately see which bins are of high overall confidences and which contigs are confidently belonging to their bins. This can guide the subsequent binning efforts.
One may also check "export result to file" to save the results (contig IDs, bin assignments and silhouette coefficients) to a TSV file.
- Be warned not to over-interpret silhouette coefficient. It is a widely-used metric for cluster analysis evaluation. However, other biological factors may also be important in the task of binning.
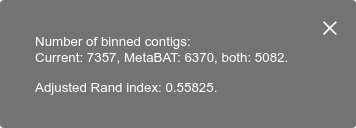
BinaRena compares two binning plans by calculating the adjusted Rand index (ARI), which measures the consistency between two grouping scenarios of the same dataset. Higher is better. Two identical plans have ARI = 1. Two random plans will have an ARI close to 0.
Select "Compare" in the dropdown menu of the bin panel, then select a categorical field (another binning plan) to perform this calculation. It is fast. The result will be displayed in a floating message box.
BinaRena can calculate these two critical metrics in real time on user-selected contigs, as in contrast to classical methods which normally run after bins are already defined.
What are completeness and redundancy? Given a feature group as defined by its membership (i.e., it contains these n features: f1, f2,... fn), completeness is the number / fraction of these features found in the selected contigs; redundancy (a.k.a., contamination) is the number / fraction of extra copies of these features present in the contigs.
To use this function, you first need to have a "feature set" column in the dataset (see details). For example, this can be the KEGG ontology (KO) annotations of predicted genes on each contig:
k99_1 <tab> K00986
k99_3 <tab> K02117,K02122,K02124,K02123,K02119,K03439
k99_10 <tab> K18349,K18479,K00763,K07098,K04769
k99_39 <tab> K25232,K07729,K02871,K02996
k99_62 <tab> K00655
...
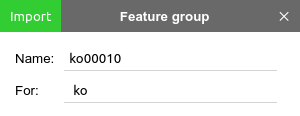
Then you need a separate file, which is a plain list of member features of a particular feature group. In this example, it is the KOs of the glycolysis pathway (ko00010).
K00844
K12407
K00845
K25026
K01810
...
Drag and drop this file into BinaRena. The program will recognize and prompt you to associate it with a feature set column.
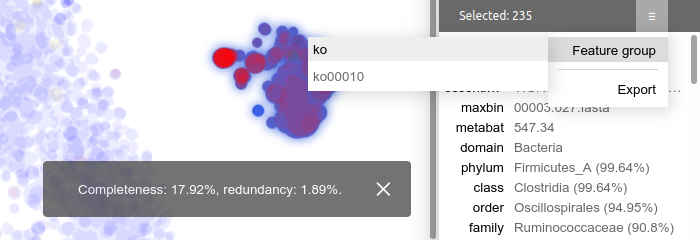
Then, whenever there are some contigs selected, you can go to the summary panel's dropdown menu, select "Feature group", then select the feature group name. The program will report the completeness and redundancy values right away.
You can load an arbitrary number of feature groups for any number of feature set columns simultaneously. This lets you explore various biological questions with high flexibility.
BinaRena provides scripts for converting CheckM lineage-specific marker genes into feature sets and feature groups, so that you can calculate the bin quality metrics on the fly in BinaRena. See details.
- Warning: BinaRena does not consider feature interchangeability -- for example, both K00845 and K12407 encode for glucokinase and an organism may just need one of them. One should be cautious in defining feature groups and interpreting the resulting numbers.