Contigs
In the interactive scatter plot, one can simply click circles (contigs) to select them. Hold Shift and click to select multiple. Click selected ones to unselect them.
A more efficient may is to press Enter or click the ⬠ button in the corner to enter the polygon selection mode.
Then one can click on the plot to draw a polygon to contain contigs of interest. When done, press Enter again and these contigs will be selected.
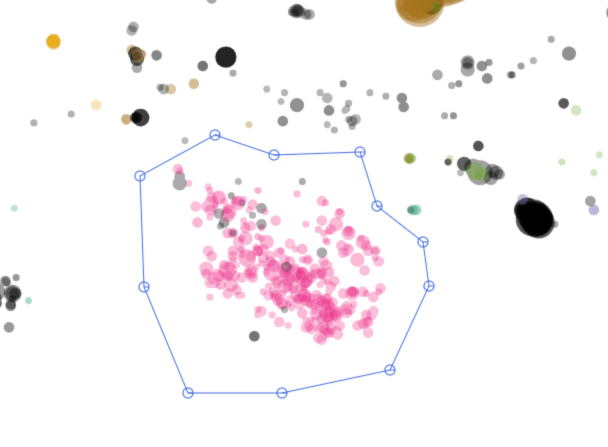
Hold Shift when finishing selection will add the contigs to the current selection.
One can press the Delete key or click the ∅ button in the corner to mask currently selected contigs. These contigs will disappear from the plot. They will also be excluded from subsequent operations (e.g., they cannot be selected, nor can they influence calculation of metrics). This function is useful for cloaking unwanted contigs during binning.
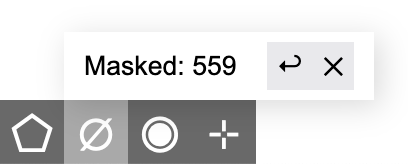
The masked contigs are not deleted from the dataset. They can be released back to the view by clicking the × button.
One can also press Z or click the ↩ button to undo previous masking operations one by one. The program allows a total of 50 regrets.
- Note that masked contigs will not be immediately deleted from bins. One can click the ∅ button in the bin table toolbar to remove masked contigs from all bins.
One can press the L key or click the ◉ button in the corner to highlight currently selected contigs. Moreover, one may select one of multiple highlight colors from the menu.
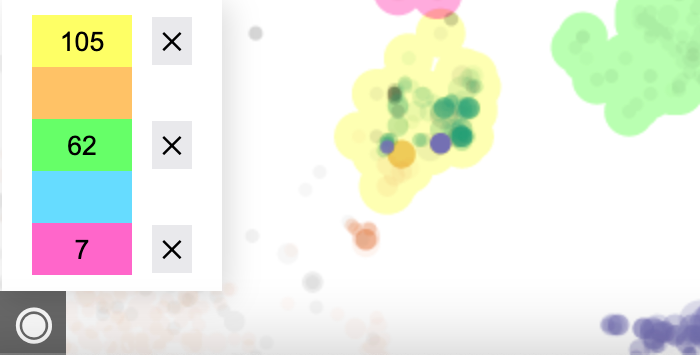
The highlight will stay with the contigs no matter how the layout and display items change, until the user clicks the × button next to each color to release them.
Highlighting will not affect binning, search, calculation and operations. It serves as a visual annotation of contigs to make them noticeable to the user.
Press the F key or click the ⊹ (cross) button in the corner to focus on selected contigs. That is, all but these contigs will be hidden, allowing you to concentrate on them. When you complete working on these contigs, press F again and bring back all other contigs.
BinaRena displays a summary of properties of the select contigs in real time to let the user see what's included. Each row represents a field. When the user moves the mouse over a row, a mini control panel will show up.
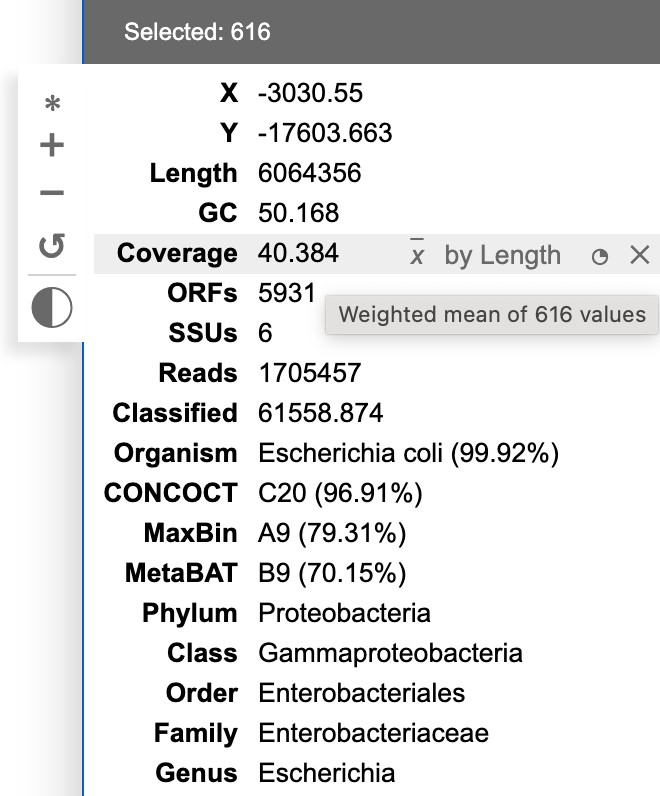
When multiple contigs are selected, the displayed value of numeric fields is calculated using either mean (x̄) or sum (Σx) of the contigs, optionally weighted by another variable. BinaRena attempts to "guess" the most relevant metric for each column. For example, "length" should be the sum of lengths of all contigs, whereas "coverage" should be the average of coverages of the contigs, weighted by contig length. One can mouse hover the displayed value to see how it is exactly calculated, and tweak the metrics (in case BinaRena didn't guess right).
For categorical columns, the displayed category is the majority-rule category, if there are multiple options (i.e., the selected contigs are a mixture), determined by weighting against the contig length (one can tweak this). The relative frequency of the main category is displayed in the parentheses. If no category is over half, the row will be displayed as "ambiguous", while the most frequent category can be found in the tooltip during mouse hovering.
One may click the ◔ button in each row to display a histogram of the distribution of this variable in a mini plot.
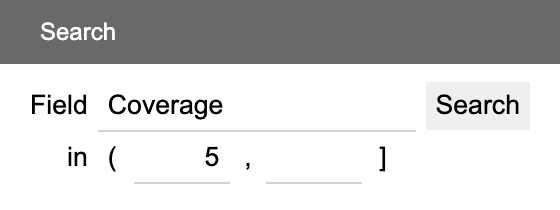
The Search panel offers functions to search the assembly for contigs that match given criteria.
For numeric fields, enter (or leave empty) maximum and minimum thresholds. Click the boundaries to toggle between exclusion (()) and inclusion ([]).
For categorical, feature set and descriptive fields, enter a keyword to search. The keyword box can auto-complete based on current categories and features. Click Aa to toggle case sensitivity and "" to toggle whole/partial matching.
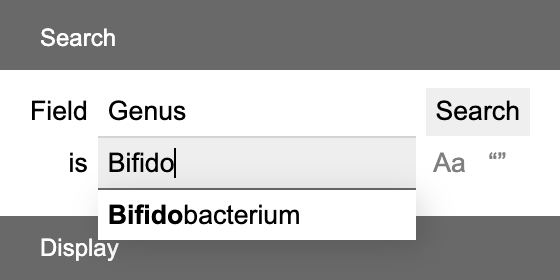
For feature set fields, the whole contig will match as long as any feature on it matches.
The mini plot panel displays an interactive histogram of a user-chosen variable of the selected contigs. Mouse over the bars to display the range and size of them. Click log to apply log-transformation. Click + and - to increase / decrease the number of bars.
One may use mouse dragging to select a range of bars. The contigs will be filtered down to the selected range.
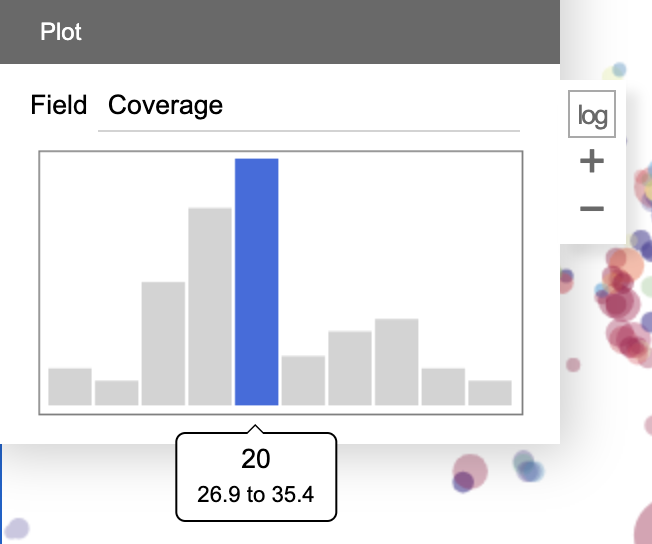
This miniplot facilitates the user to observe the distribution of the variable in a set of contigs, and further perform filtering based on the observation. For example, one may remove contaminants from a bin which appear to be outliers in the histogram; one may also separate two closely related strains which show a bimodal distribution in the histogram.