FAQ
Which web browsers support BinaRena?
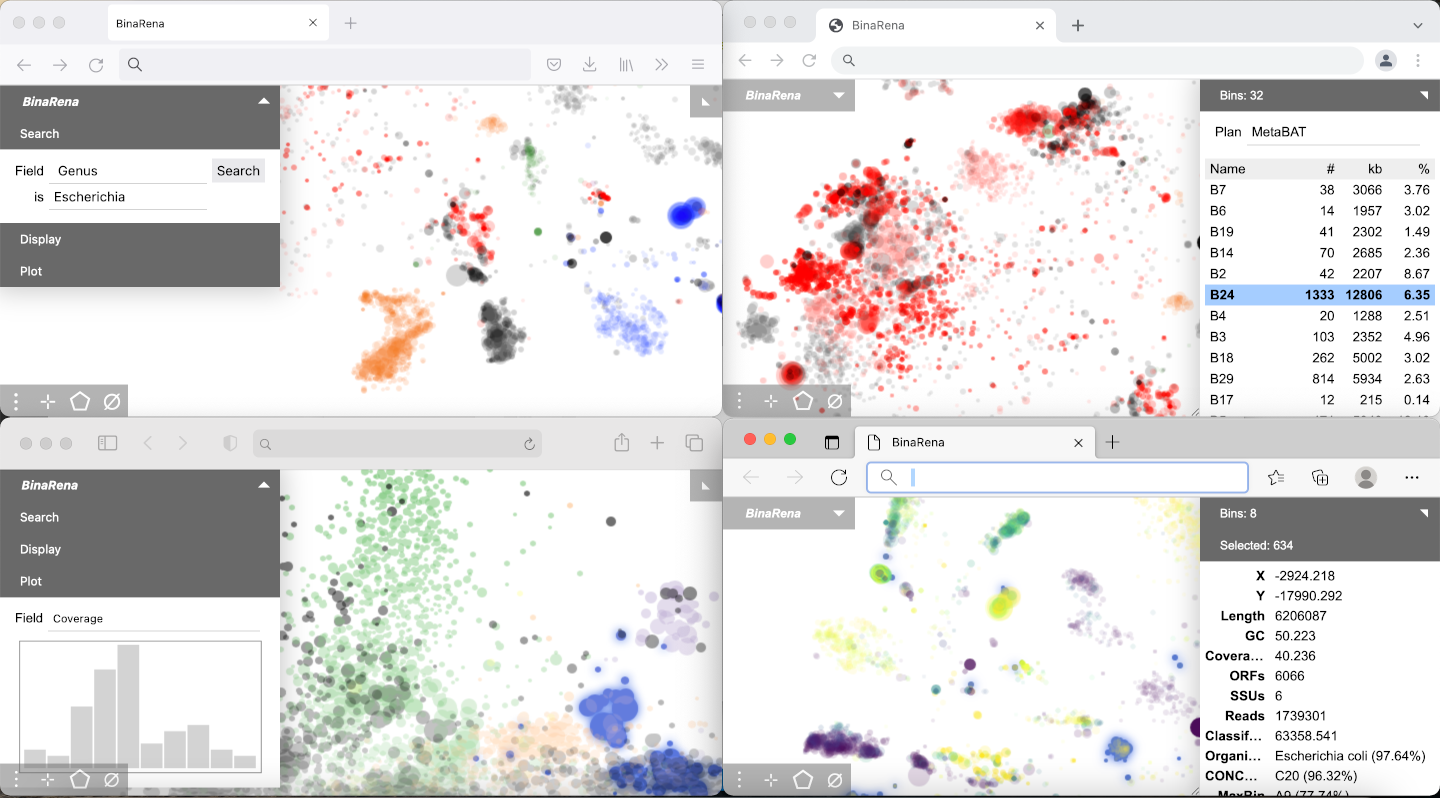
BinaRena runs in most modern web browsers, such as Chrome, Firefox, Edge, and Safari (see screenshots below).
Which operating systems support BinaRena?
Any operating system that can run a web browser supports BinaRena. Windows, macOS, Linux, Android,... you name it.
Do old browsers support BinaRena?
BinaRena is written in JavaScript, using modern language standards including ES6 and above. Modern browsers shouldn't have problems as they normally auto-update to meet the latest standards. However, very outdated browsers such as Internet Explorer may not support BinaRena.
What system configuration does BinaRena require?
A typical laptop is sufficient for running BinaRena.
Does BinaRena work on a touchscreen?
Yes! You can use your finger(s) to move and zoom the plot, as well as to select contigs, to click buttons, etc.
Is BinaRena really dependency-free?
That is accurate. The program uses zero third-party libraries, not even Node.js, either locally or remotely (i.e., it doesn't src any remote web framework or icon pack in the <script> section). The entire program is handcrafted. This minimizes the effort for deployment and usage.
In addition, we use Jasmine for unit testing core algorithms to ensure their soundness. Jasmine is bundled in the package, but it won't run when you use BinaRena.
Does BinaRena expose my data to a remote server?
The standalone BinaRena program is a client-end webpage that runs in your browser. Theoretically and technically, it cannot communicate with a web server. There is no risk with regard to the confidentiality of your data.
The live demo hosted by GitHub Pages can communicate with the GitHub repository, and the only thing it does is to retrieve the sample dataset from the repository directory. It does not perform any other communication.
Which browser works the best for BinaRena?
They all work very well. However some may bring you moderately smoother graphics than others do. Specifically, BinaRena experience is the slickest in Chrome, and other Chromium-based browsers, such as Edge, Brave, and Opera. The program may be slower in Firefox and Safari, especially when the dataset is big. Other than graphics speed, the program should behave the same across different browsers.
In case you wonder why:
For high responsiveness, BinaRena automatically caches images around the current viewport, so that it could immediately bring you to the destination when you move or zoom. BinaRena uses either of two mechanisms to achieve this: For browsers that support OffscreenCanvas, BinaRena uses this technology to cache images in a separate thread so that it won't block the UI. For others, BinaRena scavenges idle time in the main thread to cache images, which could lag the graphics a little bit.
So which browsers support OffscreenCanvas? As of 2023, Chrome does, out-of-the-box, therefore you get the highest FPS when you run BinaRena in Chrome. So does Edge. Firefox has support but it is bit experimental, and BinaRena won't use it when running in Firefox. Safari does not support this technology.
If this causes any problem, you may comment out the code under "check offscreen canvas support" in static/js/main.js to disable OffscreenCanvas (even if the browser supports it).
BinaRena doesn't display graphics in my browser?
We haven't experienced this scenario in any modern browser. But just in case your browser is highly customized or restricted... See if the previous answer helps you. If not, you will need to install a clean browser.
BinaRena is sometimes smooth but sometimes clumsy?
BinaRena can become clumsy when the dataset is large and when you are making frequent operations on the graph, such that the background caching process (see above) hasn't completed. This won't break anything. Wait for a few seconds and you will find it smooth.
How to precisely control the size of the plot?
Drag to resize the browser window. The plot will be resized along with it, during which its width and height (in the unit of pixel) will be displayed in a floating message box.
Can BinaRena display axes and ticks?
Yes. Check "Plot grid" in "Settings". There will be an interactive grid with numbers. Alternatively, in the exported SVG, axes and labels are automatically rendered.
Where are the color palettes in BinaRena from?
Most of these color palettes were adopted from Matplotlib, which have been widely utilized in Python data science. The default categorical palette "QIIME" was adopted from the EMPeror viewer of the microbiome data analysis package QIIME 2.
Can I customize the color palettes?
Not from the GUI. But look into static/js/resource.js and you know what to do.
In the exported SVG image, some data points are covered by the legends. Can I move the legends outside the plot?
The data points are covered, but they are not missing. One can open the SVG file in a vector image editor such as Inkscape, and move the legends away from the plot area. The covered elements will be revealed.
Can I customize the appearance of the exported SVG image?
The GUI doesn't provide much control. However, pro users can look into (static/js/svg.js). On top of the function renderSVG there are multiple customizable parameters.
How does BinaRena perform data ranking?
BinaRena sorts numeric values from small to large and assigns them ranks 1, 2, 3... If there are ties, all numbers in a tie will receive the average rank of them. This behavior is consistent with the default behavior of SciPy's rankdata function.
How exactly does BinaRena calculate silhouette coefficients?
The silhouette coefficient calculation algorithm in BinaRena was implemented in reference to Scikit-learn's silhouette_score function to achieve compatible results. Prior to this final step, several operations are involved for data preprocessing:
The contigs are filtered to exclude those 1) that are not in any bin, 2) that are currently masked, 3) that have invalid values in any of the variables after transformation. The remaining data are subject to min-max scaling (consistent with the default behavior of Scikit-learn's MinMaxScaler) such that each variable is within the range of [0, 1]. Then, the pairwise Euclidean distances between contigs are calculated using the scaled variables. Finally, the silhouette coefficients were calculated.
One can monitor the process and intermediates using the browser's console.
Why does silhouette coefficient calculation take so long?
Calculation of silhouette coefficients requires calculating Euclidean distance between every pair of contigs, which is computationally expensive (O(n2)). Therefore the computing time quickly builds up as the dataset becomes larger.
The program has an optimization for less than 20,000 contigs. Below this threshold, calculation is synchronous and faster (vs. data size). Above this threshold, the calculation progress will be displayed and the user has the option to abort the calculation when running out of patience.
For efficient computing, one may consider filtering down the dataset (e.g., removing short and shallow contigs) and/or masking irrelevant contig groups (masked contigs won't participate in calculation).