High-Resolution Multispectral Dataset for Semantic Segmentation
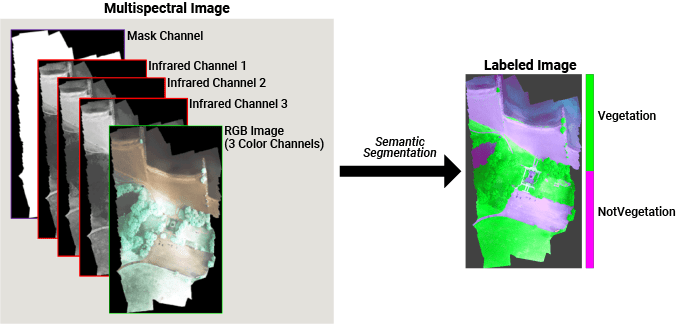
This repository contains the RIT-18 dataset we built for the semantic segmentation of remote sensing imagery. It was collected with the Tetracam Micro-MCA6 multispectral imaging sensor flown on-board a DJI-1000 octocopter. The main contributions of this dataset include 1) very-high resolution multispectral imagery from a drone, 2) six-spectral VNIR bands, and 3) 18 object classes (plus background) with a severely unbalanced class distribution. Details about its construction can be found in our paper.
If you use this dataset in a publication, please cite:
@article{kemker2018algorithms,
title = "Algorithms for semantic segmentation of multispectral remote sensing imagery using deep learning",
journal = "ISPRS Journal of Photogrammetry and Remote Sensing",
year = "2018",
issn = "0924-2716",
doi = "https://doi.org/10.1016/j.isprsjprs.2018.04.014",
url = "http://www.sciencedirect.com/science/article/pii/S0924271618301229",
author = "Ronald Kemker and Carl Salvaggio and Christopher Kanan",
}
This repository contains the following files:
- rit18_data_url: The URL to the current location of the data.
- evaluate_rit18.py: The evaluation script used to score the predicition map
- read_rit18.py: This script opens all of the data in the dataset.
The data, once downloaded, is ~3.0GB (1.58 GB compressed). It is a .mat file containing a dictionary of various elements including:
- 'train_data' : (7 x 9,393 x 5,642) numpy array containing the training ortho. The first six bands are the VNIR spectral bands and the 7th band is the mask of the orthomosaic.
- 'train_labels': (9,393 x 5,642) numpy array containing the training labels.
- 'val_data' : (7 x 8,833 x 6,918) numpy array containing the validation ortho. The first six bands are the VNIR spectral bands and the 7th band is the mask of the orthomosaic.
- 'val_labels' : (8,833 x 6,918) numpy array containing the validation labels.
- 'test_data' : (7 x 12,446 x 7,654) numpy array containing the testing ortho. The first six bands are the VNIR spectral bands and the 7th band is the mask of the orthomosaic.
- 'band_centers' : Spectral band centers
- 'band_center_units' : Units for 'band_centers'
- 'sensor' : Information about the sensor
- 'classes' : List of object classes
- 'info' : Various information about the dataset
The dataset contain pixel-wise annotations for both the training and validation folds. Both sets of labels can be used to train a classifier. It is separated as a rough per-class split, but the validation fold does not contain the black and white wooden targets. This is because we want to evaluate our model's ability to perform low-shot learning.
The goal is to have the test labels available on the IEEE GRSS evaluation server. Until then, you can e-mail me your test predictions using the following format:
- Same spatial dimensions as the test image (12,446 x 7,654)
- uint8 datatype (smaller file)
- Either .mat (MATLAB) or .npy (Python) file format
- Compressed (so you don't kill my e-mail account)
I will use your predicitions on the evaluate_rit18.py script that I provided here and send you the output file. I will not score the area outside of the mask, but the background pixels ("class 0") will be scored. As soon as I get this up on the evaluation server, then the user will be able to do all of this themselves.
Our dataset was recently featured in a MATLAB Deep Learning Tutorial called Semantic Segmentation of Multispectral Images Using Deep Learning.
- Ronald Kemker - www.linkedin.com/in/ronald-kemker-66250b115
- Carl Salvaggio - https://www.cis.rit.edu/~cnspci/
- Chris Kanan - http://www.chriskanan.com/
- EarthMapper Pipeline for Semantic Segmentation of Remote Sensing Imagery - https://github.com/rmkemker/EarthMapper
- Machine and Neuromorphic Perception Laboratory - http://klab.cis.rit.edu/
- New URL for RIT-18 Dataset - https://www.rit.edu/dirs/rit-18
