warp view chart
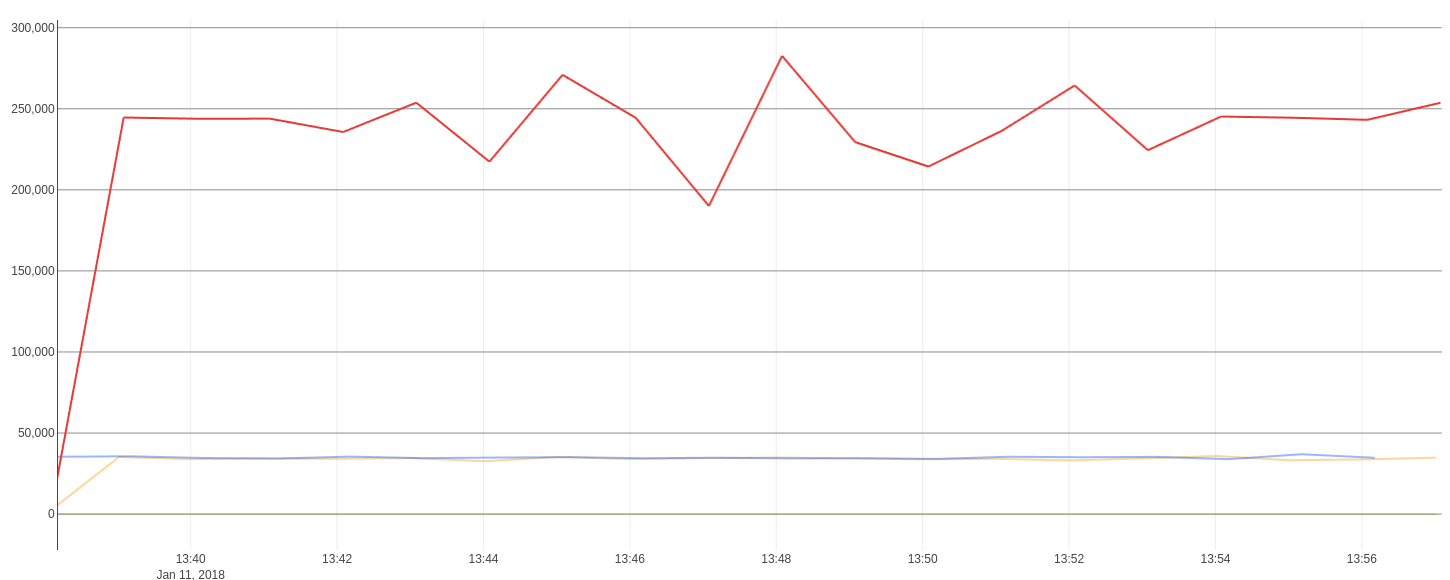
type = line
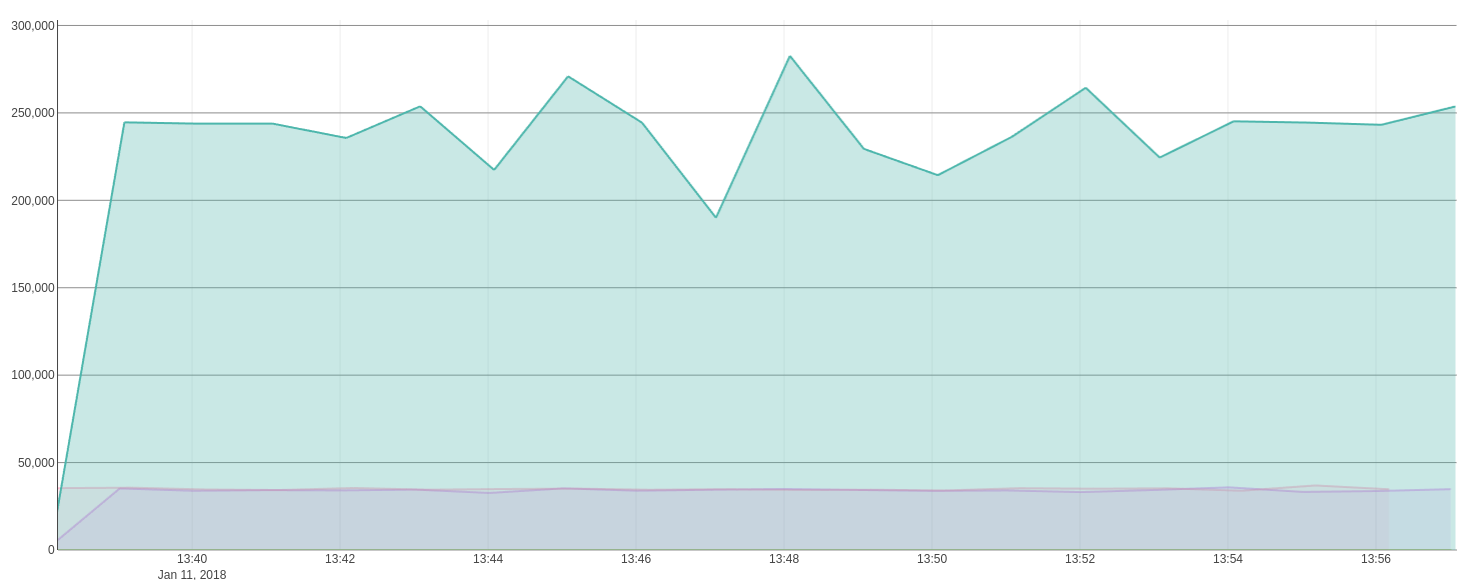
type = area
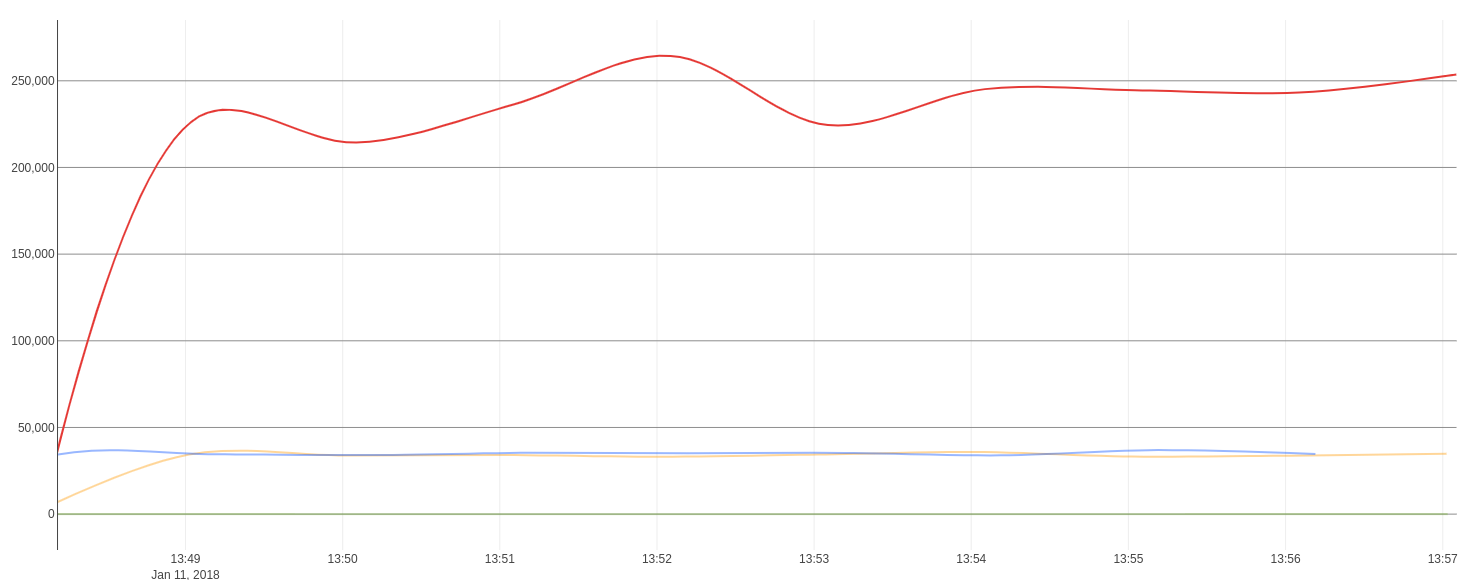
type = spline
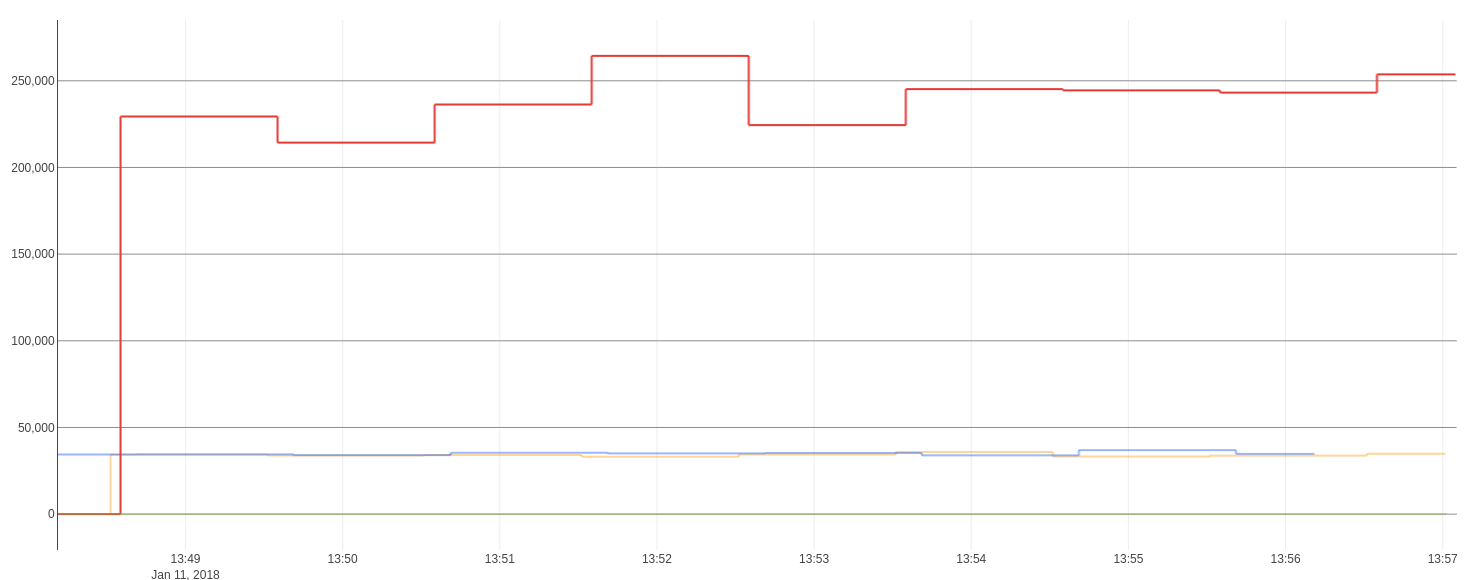
type = step
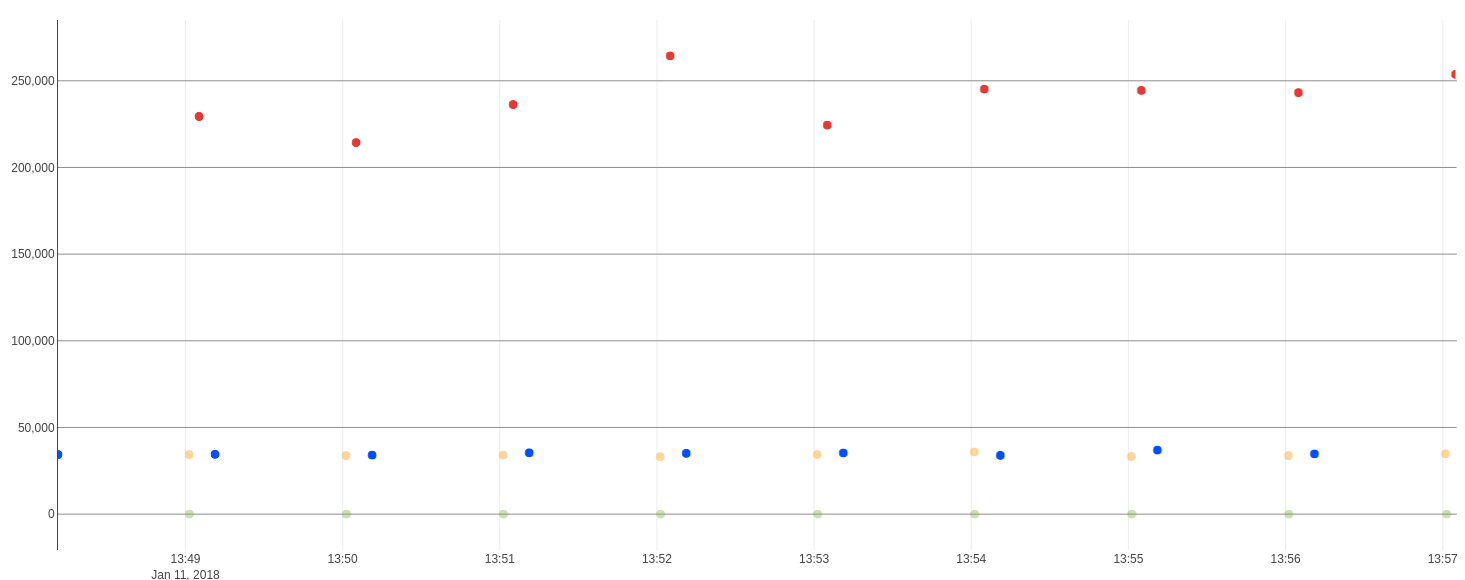
type = scatter
- Tooltip
- --warp-view-chart-legend-bg
- --warp-view-chart-legend-color
- Size
- --warp-view-chart-width
- --warp-view-chart-height
- Colors
- --warp-view-font-color
- --warp-view-chart-grid-color
| Name | Type | Description |
|---|---|---|
| pointHover | { x: number, y: number } |
Emit mouse position |
| boundsDidChange | { bounds: { min: number, max: number }, source: 'chart' } |
Emit new time range after scroll/zoom in ms if timeMode is 'date', in us if timeMode is timestamp |
GTS, GTS array or complex data.
| Name | Type | Default | Description |
|---|---|---|---|
| showRangeSelector | boolean |
true | Display a time range selector |
| timeMode | string |
'date' | date, timestamp |
| showDots | boolean |
false | Show dots on traces |
| type | string |
'line' | Chart type, could be: 'line', 'spline', 'step', 'step-after', 'step-before', 'area', 'scatter' |
<warpview-tile
          url="https://warp.senx.io/api/v0/exec"
          responsive="true"
          type="line">
0 5 <% 'j' STORE
    NEWGTS 'series' $j TOSTRING + RENAME 'gts' STORE
    0 10 <%
        'i' STORE
        $gts NOW $i RAND + STU * - RAND RAND RAND 1000.0 * RAND  ADDVALUE DROP
    %> FOR
    $gts
%> FOR
</warpview-tile>