
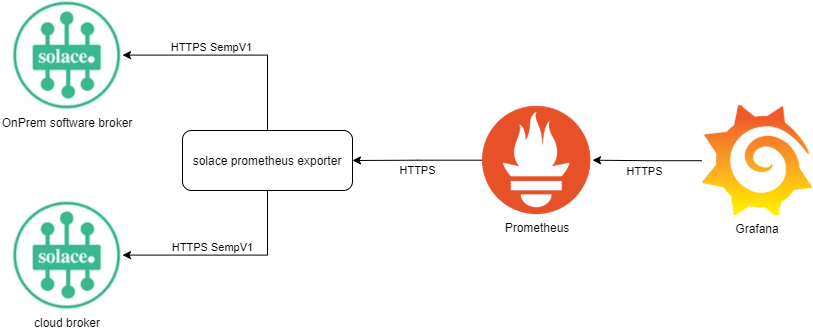
The exporter is written in go, based on the Solace Legacy SEMP protocol. It grabs metrics via SEMP v1 and provides those as prometheus friendly http endpoints.
Video Intro available on YouTube: Integrating Prometheus and Grafana with Solace PubSub+ | Solace Community Lightning Talk
It implements the following endpoints:
http://<host>:<port>/                    Document page showing list of endpoints
http://<host>:<port>/metrics             Golang and standard Prometheus metrics
http://<host>:<port>/solace-std          legacy, via config: Solace metrics for System and VPN levels
http://<host>:<port>/solace-det          legacy, via config: Solace metrics for Messaging Clients and Queues
http://<host>:<port>/solace-broker-std   legacy, via config: Solace Broker only Standard Metrics (System)
http://<host>:<port>/solace-vpn-std      legacy, via config: Solace Vpn only Standard Metrics (VPN), available to non-global access right admins
http://<host>:<port>/solace-vpn-stats    legacy, via config: Solace Vpn only Statistics Metrics (VPN), available to non-global access right admins
http://<host>:<port>/solace-vpn-det      legacy, via config: Solace Vpn only Detailed Metrics (VPN), available to non-global access right admins
http://<host>:<port>/solace              The modular endpoint
Configure the data you want ot to receive via HTTP GET parameters.
The key is always the scrape target prefixed by a m..
The value contains out of 2–3 parts, delimited by a pipe |.
- The first part is the VPN filter.
- The second part is the ITEM filter.
- The third part is the METRIC filter.
Not all scrape targets support both filters. Please see scrape target to find out what is supported
where.
The first both filters can contain multiple asterisk * as wildcard for N chars.
Each scrape target can be used multiple times, to implement or condition filters.
Here are only the first two filters are supported.
The VPN filter can be an asterix. The ITME filter is using the semp v1 semantic (* is a wildcard for one or more chars).
Get the same result as the legacy solace-det endpoint.
http://your-exporter:9628/solace?m.ClientStats=*|*&m.VpnStats=*|*&m.BridgeStats=*|*&m.QueueRates=*|*&m.QueueDetails=*|*
Get the same result as the legacy solace-det endpoint, but only from VPN myVpn.
http://your-exporter:9628/solace?m.ClientStats=myVpn|*&m.VpnStats=myVpn|*&m.BridgeStats=myVpn|*&m.QueueRates=myVpn|*&m.QueueDetails=myVpn|*
Get all queue information, where the queue name starts with BRAVOor ARBON and only from VPN myVpn.
http://your-exporter:9628/solace?m.QueueStats=myVpn|ARBON*&m.QueueStats=myVpn|BRAVO*&m.QueueDetails=myVpn|ARBON*&m.QueueDetails=myVpn|BRAVO*
Get all queue information, where the queue name starts with BRAVOor ARBON and only from VPN where the name contains
a my.
http://your-exporter:9628/solace?m.QueueStats=*my*|ARBON*&m.QueueStats=*my*|BRAVO*&m.QueueDetails=*my*|ARBON*&m.QueueDetails=*my*|BRAVO*
Get all queue information, where the queue name starts with BRAVOor ARBON and only from VPN where the name contains
a my and ends with and prod.
http://your-exporter:9628/solace?m.QueueStats=*my*prod|ARBON*&m.QueueStats=*my*prod|BRAVO*&m.QueueDetails=*my*prod|ARBON*&m.QueueDetails=*my*prod|BRAVO*
Get the same result as the legacy solace-det endpoint, but from a specific broker.
http://your-exporter:9628/solace?m.ClientStats=*|*&m.VpnStats=*|*&m.BridgeStats=*|*&m.QueueRates=*|*&m.QueueDetails=*|*&scrapeURI=http://your-broker-url:8080
Here are only the first two filters are supported.
The VPN filter may NOT be asterix. You are advised to always provide a valid vpn name. Wildcards are not supported. In case you provide an asterix, the "DefaultVpn" from configuration will be used.
The ITME filter is using the semp v2 semantic (* is a wildcard for one or more chars). You can either provide only the filter string, in this case main field and == will be prepended.
Or you provide full qualified solace sep v2 filter like:
queueName!=internal* All queues that are NOT internal.
queueName==important* Only important queues.
The METRIC filter limits the metrics that are returned. Please use the feature to save resources of the broker and your prometheus. Some fields are more costly than others. By only returning required metrics, you can speed up semp v2 query dramatically. Provide a comma separated list of either semp v2 field names or metrics names.
Get the metrics solace_queue_msg_shutdown_discarded and solace_queue_msg_max_redelivered_discarded for all queues
not starting with the word "internal"
http://your-exporter:9628/solace?m.QueueStatsV2=AaaBbbCcc|queueName!=internal*|solace_queue_msg_shutdown_discarded,solace_queue_msg_max_redelivered_discarded
| scrape target | vpn filter supports | item filter supported | metrics filter supported | performance impact | corresponding cli cmd | supported by |
|---|---|---|---|---|---|---|
| Version | no | no | no | dont harm broker | show version | software, appliance |
| Health | no | no | no | dont harm broker | show system health | software |
| StorageElement | no | yes | no | dont harm broker | show storage-element storageElementFilter | software |
| Disk | no | no | no | dont harm broker | show disk detail | appliance |
| Memory | no | no | no | dont harm broker | show memory | software, appliance |
| Interface | no | yes | no | dont harm broker | show interface interfaceFilter | software, appliance |
| GlobalStats | no | no | no | dont harm broker | show stats client | software, appliance |
| GlobalSystemInfo | no | no | no | dont harm broker | show system | software, appliance |
| Spool | no | no | no | dont harm broker | show message-spool | software, appliance |
| Redundancy (only for HA broker) | no | no | no | dont harm broker | show redundancy | software, appliance |
| ConfigSync (only for HA broker) | no | no | no | dont harm broker | show config-sync | software, appliance |
| ConfigSyncRouter (only for HA broker) | no | no | no | dont harm broker | show config-sync database router | software, appliance |
| Replication (only for DR broker) | no | no | no | dont harm broker | show replication stats | software, appliance |
| Vpn | yes | no | no | dont harm broker | show message-vpn vpnFilter | software, appliance |
| VpnReplication | yes | no | no | dont harm broker | show message-vpn vpnFilter replication | software, appliance |
| ConfigSyncVpn (only for HA broker) | yes | no | no | dont harm broker | show config-sync database message-vpn vpnFilter | software, appliance |
| Bridge | yes | yes | no | dont harm broker | show bridge itemFilter message-vpn vpnFilter | software, appliance |
| VpnSpool | yes | no | no | dont harm broker | show message-spool message-vpn vpnFilter | software, appliance |
| Client | yes | yes | no | may harm broker if many clients | show client itemFilter message-vpn vpnFilter connected | software, appliance |
| ClientSlowSubscriber | yes | yes | no | may harm broker if many clients but less expensive than ClientStats |
show client itemFilter message-vpn vpnFilter slow-subscriber | software, appliance |
| ClientStats | yes | no | no | may harm broker if many clients | show client itemFilter stats (paged) | software, appliance |
| ClientConnections | yes | no | no | may harm broker if many clients | show client itemFilter stats | software, appliance |
| ClientMessageSpoolStats | yes | no | no | may harm broker if many clients | show client itemFilter stats(paged) | software, appliance |
| VpnStats | yes | no | no | has a very small performance down site | show message-vpn vpnFilter stats | software, appliance |
| BridgeStats | yes | yes | no | has a very small performance down site | show bridge itemFilter message-vpn vpnFilter stats | software, appliance |
| QueueRates | yes | yes | no | DEPRECATED: may harm broker if many queues | show queue itemFilter message-vpn vpnFilter rates count 100 (paged) | software, appliance |
| QueueStats | yes | yes | no | may harm broker if many queues | show queue itemFilter message-vpn vpnFilter rates count 100 (paged) | software, appliance |
| QueueStatsV2 | yes | yes | yes | may harm broker if many queues | show queue itemFilter message-vpn vpnFilter rates count 100 (paged) | software, appliance |
| QueueDetails | yes | yes | no | may harm broker if many queues | SempV2 monitoring /queue/getMsgVpnQueues 100 (paged) | software, appliance |
| TopicEndpointRates | yes | yes | no | DEPRECATED: may harm broker if many topic-endpoints | show topic-endpoint itemFilter message-vpn vpnFilter rates count 100 (paged) | software, appliance |
| TopicEndpointStats | yes | yes | no | may harm broker if many topic-endpoint | show topic-endpoint itemFilter message-vpn vpnFilter rates count 100 (paged) | software, appliance |
| TopicEndpointDetails | yes | yes | no | may harm broker if many topic-endpoints | show topic-endpoint itemFilter message-vpn vpnFilter detail count 100 (paged) | software, appliance |
| ClusterLinks | yes | yes | no | dont harm broker | show the state of the cluster links. Filters are for clusterName and linkName | software, appliance |
| Alarm | no | no | no | dont harm broker | show alarm | appliance |
| BridgeRemote | yes | yes | no | dont harm broker | show bridge itemFilter message-vpn vpnFilter | software, appliance |
| Environment | yes | no | no | dont harm broker | show environment | appliance |
| Hardware | no | no | no | dont harm broker | show hardware | appliance |
| InterfaceHW | no | yes | no | dont harm broker | show interface interfaceFilter | appliance |
| Raid | no | no | no | dont harm broker | show disk | appliance |
Those are semp V2 endpoints. Please avoid those. These are still experimental caused by the terrible performance of semp V2. For example, getting queue stats with a filter that match 4500 out of 10`000 queues. Using a 10.5.1 software broker.
- With SempV1, it took 37.1 sec to fetch all pages/results.
- With SempV2, it took 136.2 sec to fetch all pages/results.
There are metrics that may be provided by multiple endpoints. But not with the same labels. For example:
| scrape target | sample metric |
|---|---|
| ClientSlowSubscriber | solace_client_slow_subscriber{client_name="Try-Me-Pub/solclientjs/chrome-120.0.0-Windows-0.0.0/4120211072/0001",client_address="10.170.74.225",vpn_name="AaaBbbCcc"} 1 |
| ClientStats | solace_client_slow_subscriber{client_name="Try-Me-Pub/solclientjs/chrome-120.0.0-Windows-0.0.0/4120211072/0001",client_username="my_username",vpn_name="AaaBbbCcc"} 1 |
Because this is a problem for Prometheus, you need to choose only one of three endpoints you want to use.
Otherwise, you will find in log a message like: descriptors reported by collector have inconsistent label names or help strings for the same fully-qualified name, offender is Desc{fqName: "solace_client_slow_subscriber ", help: "Is client a slow subscriber? (0=not slow, 1=slow).", constLabels: {}, variableLabels: {vpn_name,client_name,client_username}}
But why exist these metrics twice?
ClientStats: Provides the most useful information/label. Because it provides you the client_username.ClientSlowSubscriber: Is a much cheaper endpoint compared toClientStatsbut provides only the client IP not the username.
You now have the responsibility,
to determine whether your broker has a low enough number of clients to safely use of ClientStats to be non-detrimental.
However, refrain from using both simultaneously.
No matter which combination of targets and filters you're using, there is always one metric available that will show the success (or failure) when trying to connect to the Solace broker.
# HELP solace_up Was the last scrape of Solace broker successful.
# TYPE solace_up gauge
solace_up{error=""} 1
If any problem arises while querying the broker, the metric value will become 0 and the label will show the most
recent error as shown in the following examples:
solace_up{error="Get \"http://localhost:8080/SEMP\": dial tcp 127.0.0.1:8080: connect: connection refused"} 0
solace_up{error="HTTP status 401 (Unauthorized)"} 0
...
If you want to keep the endpoint urls short, you can configure endpoints via ini file.
[endpoint.solace-det]
ClientStats = *|*
VpnStats = *|*
BridgeStats = *|*
QueueRates = *|*
QueueDetails = *|*
This will provide a new endpoint.
http://your-exporter:9628/solace-det
This will provide the same output as:
http://your-exporter:9628/solace?m.ClientStats=*|*&?m.VpnStats=*|*&?m.BridgeStats=*|*&?m.QueueRates=*|*&?m.QueueDetails=*|*
If you want to use wildcards to only have a subset but need more than one wildcard, you have to add a dot and an incrementing number. Like this:
[endpoint.my-sample]
QueueRates.0 = *|internal/tms/iad/*
QueueRates.1 = *|bridge_*The registered default port for Solace is 9628
solace_prometheus_exporter -h
usage: solace_prometheus_exporter [<flags>]

Flags:
  -h, --help                     Show context-sensitive help (also try --help-long and --help-man).
      --log.level=info           Only log messages with the given severity or above. One of: [debug, info, warn, error]
      --log.format=logfmt        Output format of log messages. One of: [logfmt, json]
      --config-file=CONFIG-FILE  Path and name of config file. See sample file solace_prometheus_exporter.ini.
      --enable-tls               Set to true, to start listenAddr as TLS port. Make sure to provide valid server certificate and private key files.
      --certificate=CERTIFICATE  If using TLS, you must provide a valid server certificate in PEM format. Can be set via config file, cli parameter or env variable.
      --private-key=PRIVATE-KEY  If using TLS, you must provide a valid private key in PEM format. Can be set via config file, cli parameter or env variable.
      --cert-type=CERT-TYPE      Set the certificate type PEM | PKCS12.
      --pkcs12File=PKCS12FILE    If using TLS, you must provide a valid pkcs12 file.
      --pkcs12Pass=PKCS12PASS    If using TLS, you must provide a valid pkcs12 password.
The configuration parameters can be placed into a config file or into a set of environment variables or can be given via
URL. If you use docker, you should prefer the environment variable configuration method (see below).
If the exporter is started with a config file argument, then the config file entries have precedence over the
environment variables. If a parameter is neither found in the URL, nor the config file nor in the environment, the
exporter exits with an error.
solace_prometheus_exporter --config-file=/path/to/config/file.iniSample config file:
[solace]
# Address to listen on for web interface and telemetry.
listenAddr = 0.0.0.0:9628

# Enable TLS on listenAddr endpoint. Make sure to provide certificate and private key files when using certType=PEM or or PKCS12 file and password when using PKCS12.
# can be overridden via env variable SOLACE_LISTEN_TLS or via cli parameter --enable-tls
enableTLS=false

# Path to the server certificate (including intermediates and CA's certificate)
# can be overridden via env variable SOLACE_SERVER_CERT or via cli parameter --certificate=cert.pem
certificate=cert.pem

# Path to the private key pem file
# can be overridden via env variable SOLACE_PRIVATE_KEY or via cli parameter --private-key=key.pem
privateKey=key.pem

# Set the certificate type PEM | PKCS12. Make sure to provide certificate and private key files for PEM or PKCS12 file and password.
# can be overridden via env variable SOLACE_LISTEN_CERTTYPE or via cli parameter --cert-type
certType=PEM

# Path to the server certificate (including intermediates and CA's certificate)
# can be overridden via env variable SOLACE_PKCS12_FILE or via cli parameter --pkcs12File=keystore.p12
pkcs12File=keystore.p12

# Password to decrypt PKCS12 file.
# can be overridden via env variable SOLACE_PKCS12_PASS or via cli parameter --pkcs12Pass=passwordHere
pkcs12Pass=123456

# Base URI on which to scrape Solace broker.
scrapeUri = http://your-exporter:8080

# Note: try with your browser, you should see the broker login page, where you can test the username and password below as well.
# Basic Auth username for http scrape requests to Solace broker.
username = admin

# Basic Auth password for http scrape requests to Solace broker.
password = admin

# Timeout for http scrape requests to Solace broker.
timeout = 5s

# Flag that enables SSL certificate verification for the scrape URI.
sslVerify = false

# Flag that enables HW Broker specific targets and disables SW specific ones.
isHWBroker=false

# Flag that enables Usage of the operating system proxy configuration.
# false=No proxy will be used at all.
useSystemProxy = false

# 0s means disabled. When set an interval, all well configured endpoints will fetched async.
# This may help you to deal with slower broker or extreme amount of results.
prefetchInterval = 30s

# Maximum connections to the configured broker. Keep in mind solace advices us to use max 10 semp connects per seconds.
# Dont increase this value if your broker may have more thant 100 clients, queues, ...
parallelSempConnections = 1Sample environment variables:
SOLACE_LISTEN_ADDR=0.0.0.0:9628
SOLACE_LISTEN_TLS=true
SOLACE_IS_HW_BROKER=false
SOLACE_SERVER_CERT=/path/to/your/cert.pem
SOLACE_PRIVATE_KEY=/path/to/your/key.pem
SOLACE_LISTEN_CERTTYPE=PEM
SOLACE_PKCS12_FILE=/path/to/your/keystore.p12
SOLACE_PKCS12_PASS=123456
SOLACE_SCRAPE_URI=http://your-broker:8080
SOLACE_USERNAME=admin
SOLACE_PASSWORD=admin
SOLACE_TIMEOUT=5s
SOLACE_SSL_VERIFY=falseYou can call:
https://your-exporter:9628/solace?m.ClientStats=*|*&m.VpnStats=*|*&scrapeURI=https%3A%2F%2Fyour-broker%3A943&username=monitoring&password=monitoring&timeout=10s
This service grabs metrics via SEMP v1 and provides those as prometheus friendly http endpoints. This allows you to overwrite the parameters, which are in the ini-config file / environment variables:
- scrapeURI
- username
- password
- timeout
This provides you a single exporter for all your OnPrem brokers.
Security: Only use this feature with HTTPS.
- job_name: 'solace-std'
  scrape_interval: 15s
  metrics_path: /solace-std
  static_configs:
    - targets:
      - https://USER:PASSWORD@first-broker:943
      - https://USER:PASSWORD@second-broker:943
      - https://USER:PASSWORD@third-broker:943
  relabel_configs:
    - source_labels: [__address__]
      target_label: __param_target
    - source_labels: [__param_target]
      target_label: instance
    - target_label: __address__
      replacement: solace-exporter:9628
cd <some-directory>/solace-prometheus-exporter
go buildA build Dockerfile is included in the repository.
This is used to automatically build and push the latest image to the Dockerhub
repository solacecommunity/solace-prometheus-exporter
Environment variables are recommended to parameterize the exporter in Docker.
Put the following parameters, adapted to your situation, into a file on the local host, e.g., env.txt:
SOLACE_LISTEN_ADDR=0.0.0.0:9628
SOLACE_SCRAPE_URI=http://your-broker:8080
SOLACE_USERNAME=admin
SOLACE_PASSWORD=admin
SOLACE_TIMEOUT=5s
SOLACE_SSL_VERIFY=false
Then run
docker run -d \
 -p 9628:9628 \
 --env-file env.txt \
 --name solace-exporter \
solacecommunity/solace-prometheus-exporterThe sub directory testfiles contains some sample curl commands and their outputs. This is just fyi and not needed for building.
Please ensure to run this application only in a secured network or protected by a reverse proxy.
It may reveal insights of your application you don`t want.
If you use the feature to pass broker credentials via HTTP body/header, you are forced to enable TLS on the listening
port or to run this application within kubernetes/openshift or similar to add an HTTPS layer.
By default, the endpoint configured via listenAddr=0.0.0.0:9628 is unencrypted and served via HTTP only.
To enable encryption make sure to set enableTLS=true or use the environment variable export SOLACE_LISTEN_TLS=true
or cli flag --enable-tls respectively.
TLS encryption requires you to provide two files in PEM (base64) format. You can define the path to those files in different ways:
- Certificate Type (If not defined, it'll defaut to PEM)
- cli parameter:
--cert-type=PEM - environment variable:
SOLACE_LISTEN_CERTTYPE=PEM - config file:
certType=PEM
- cli parameter:
- Server certificate (including intermediates and CA's certificate)
- cli parameter:
--certificate=cert.pem - environment variable:
SOLACE_SERVER_CERT - config file:
certificate=cert.pem
- cli parameter:
- Server private Key
- cli parameter:
--private-key=key.pem - environment variable:
SOLACE_PRIVATE_KEY - config file:
privateKey=key.pem
- cli parameter:
If you're running the exporter via Docker container, you can map the certificate files during your docker run command
from the host to the container.
docker run -d \
 -p 9628:9628 \
 --env-file env.txt \
 -v ${PWD}/cert.pem:/etc/solace/cert.pem \
 -v ${PWD}/key.pem:/etc/solace/key.pem \
 [...]
 solacecommunity/solace-prometheus-exporter
Of course, make sure to set the right local paths in the env.txt provided.
SOLACE_LISTEN_TLS=true
SOLACE_SERVER_CERT=/etc/solace/cert.pem
SOLACE_PRIVATE_KEY=/etc/solace/key.pemYou can define the path and the password in different ways:
- Certificate Type (If not defined, it'll defaut to PEM)
- cli parameter:
--cert-type=PKCS12 - environment variable:
SOLACE_LISTEN_CERTTYPE=PKCS12 - config file:
certType=PKCS12
- cli parameter:
- Path to PKCS12 Keystore File
- cli parameter:
--pkcs12File=keystore.p12 - environment variable:
SOLACE_PKCS12_FILE=/path/to/your/keystore.p12 - config file:
pkcs12File=keystore.p12
- cli parameter:
- Password for PCS12 Keystore
- cli parameter:
--pkcs12Pass=123456 - environment variable:
SOLACE_PKCS12_PASS=123456 - config file:
pkcs12Pass=123456
- cli parameter:
If you're running the exporter via Docker container, you can map the keystore file during your docker run command
from the host to the container.
docker run -d \
 -p 9628:9628 \
 --env-file env.txt \
 -v ${PWD}/keystore.p12:/etc/solace/keystore.p12 \
 [...]
 solacecommunity/solace-prometheus-exporter
Of course, make sure to set the right local path and the pssword in the env.txt provided.
SOLACE_LISTEN_TLS=true
SOLACE_LISTEN_CERTTYPE=PKCS12
SOLACE_PKCS12_FILE=/etc/solace/keystore.p12
SOLACE_PKCS12_PASS=123456For more information, try these resources:
- The Solace Developer Portal website at: https://solace.dev
- Ask the Solace Community
Please read CONTRIBUTING.md for details on our code of conduct, and the process for submitting pull requests to us.
See the list of contributors who participated in this project.
See the LICENSE file for details.