Missing monitoring to notify admins of mass recloning events #9789
Assignees

Milestone
Comments
slimsag
added a commit
that referenced
this issue
Apr 13, 2020
…board Before: 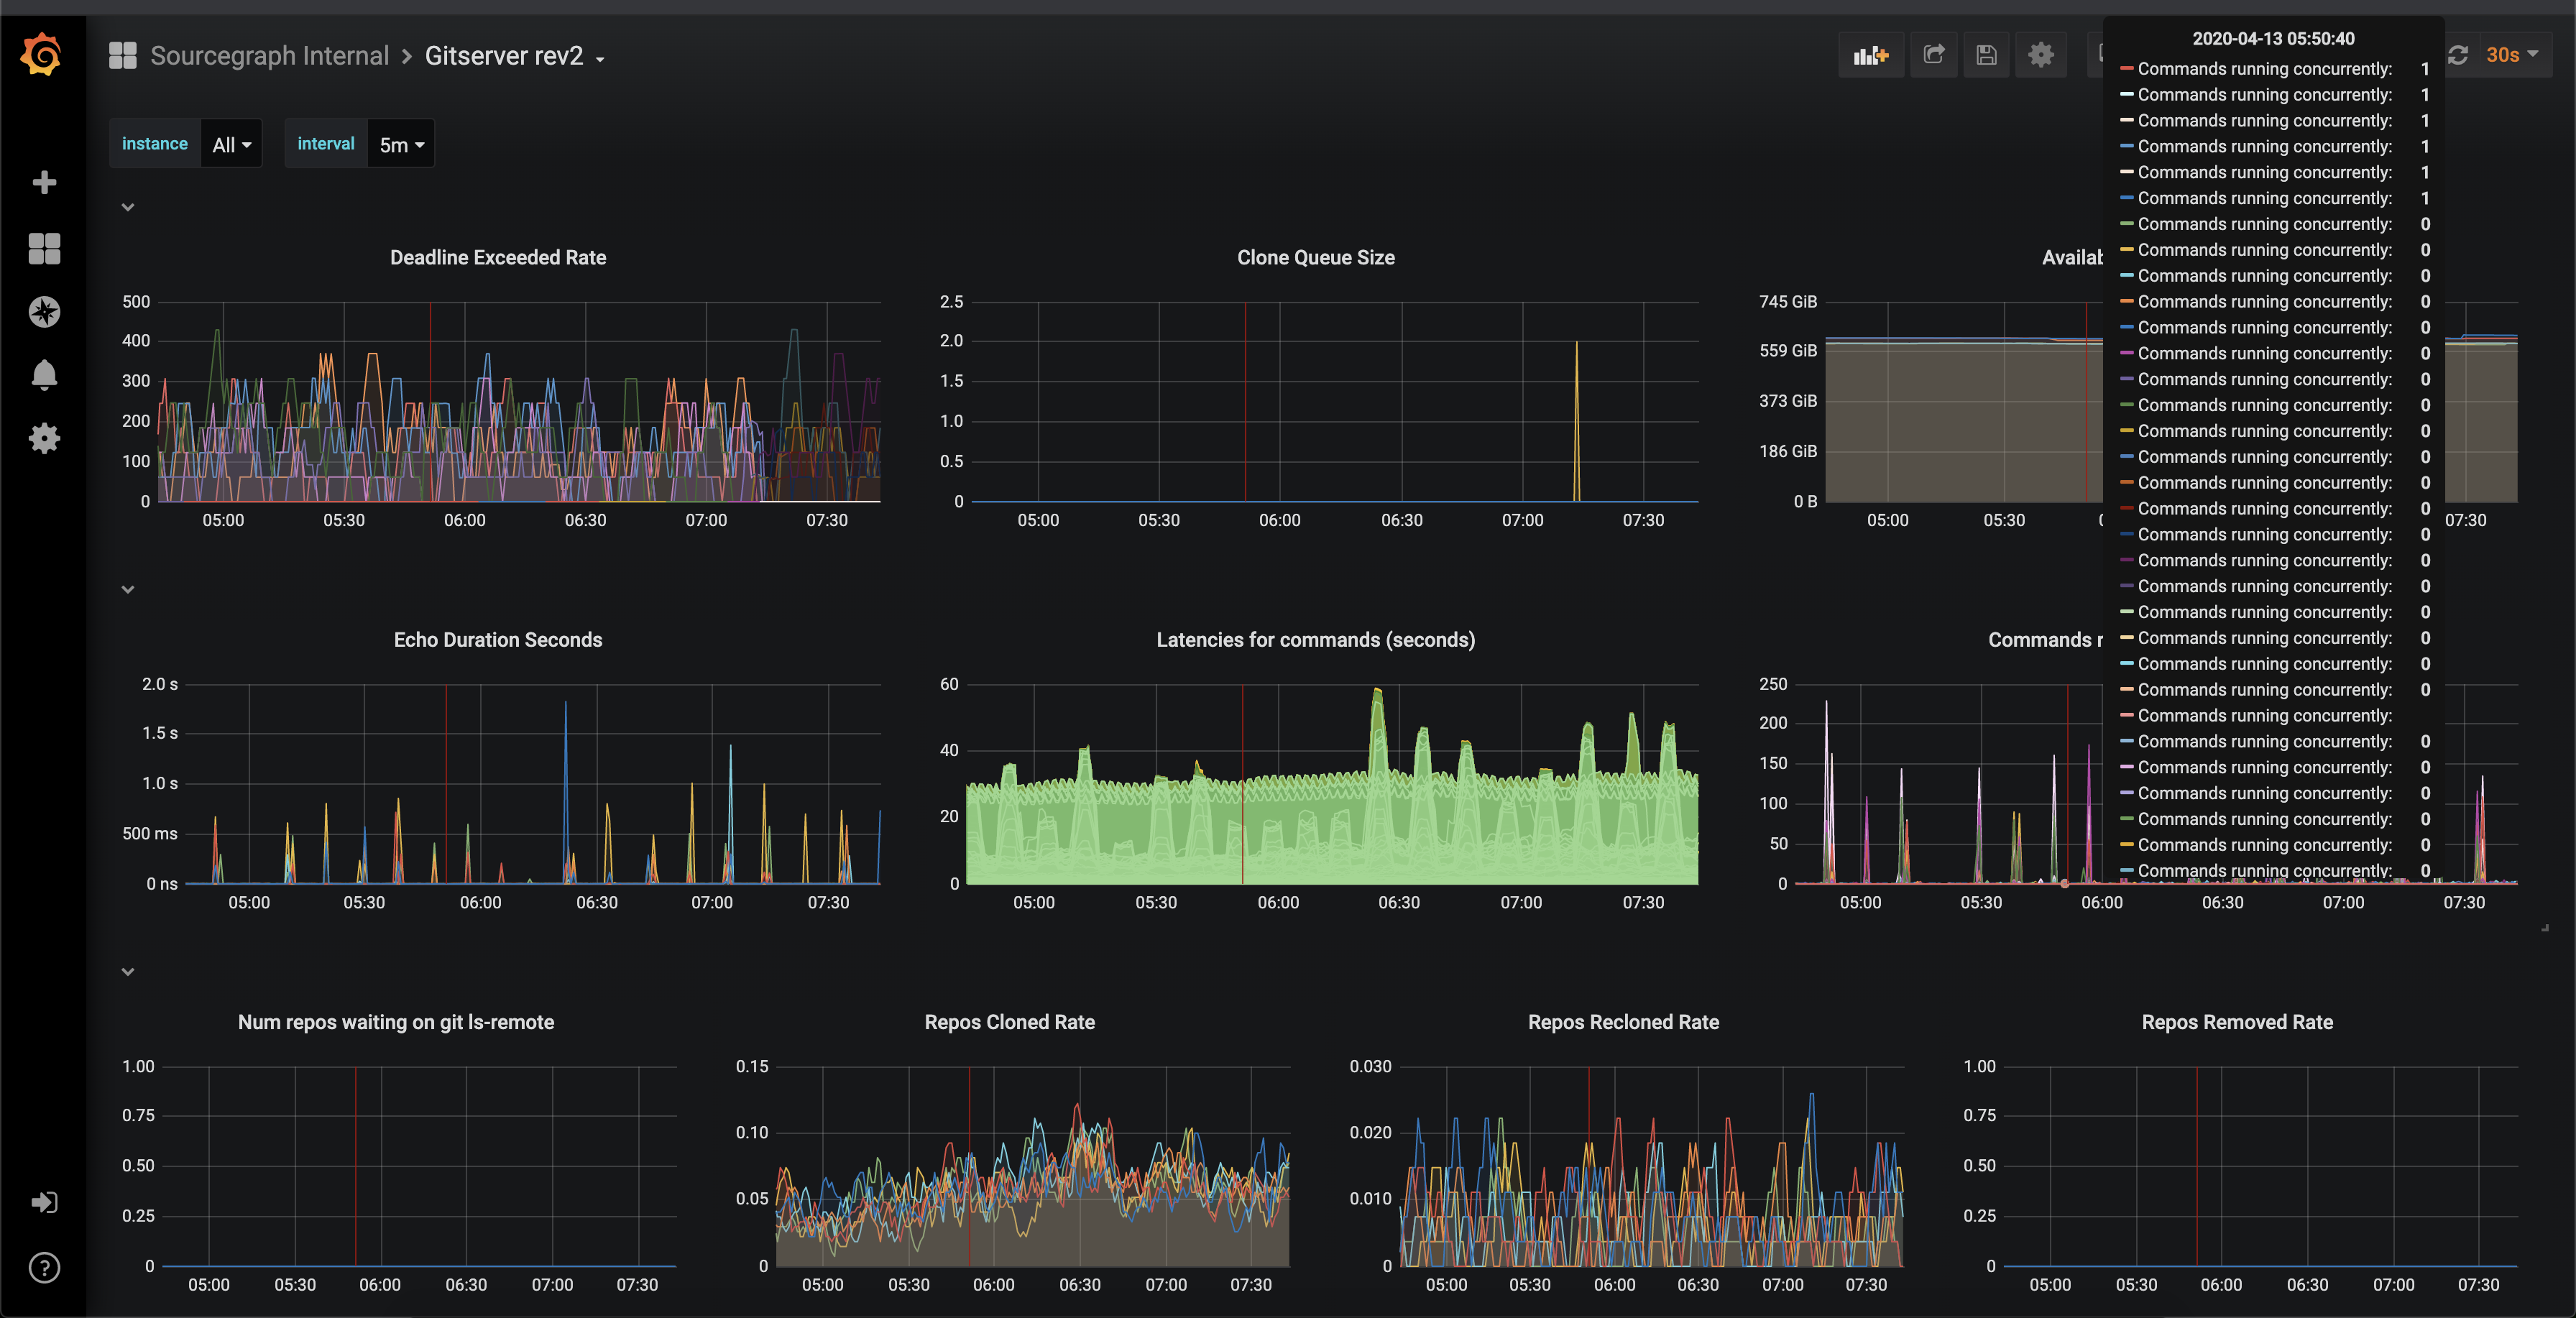 - `Deadline Exceeded Rate` MAY be a useful metric, but right now is far too high and random to give any useful information. Will revisit later: #9786 - `Clone Queue Size`: covered by new monitoring already. - `Available Disk Space`: covered by new monitoring already, but only in percentages. Filed #9787 - `Echo Duration Seconds`: covered by new monitoring already. - `Latencies for commands (seconds)`: this panel is currently misleading and broken because it operating on the rate of a bucket metric (???); filed #9788 - `Commands Running Concurrently`: covered by new monitoring already. - `Num repos waiting on git ls-remote`: This is a heavily misleading title (makes it sound like this blocks repo actions, which it does not); covered by new monitoring already. - `Repos Cloned Rate`: Covered more effectively by clone queue size in new monitoring. - `Repos Recloned Rate`: Not yet covered, filed #9789 - `Repos Removed Rate`: Not yet covered, filed #9790
slimsag
added a commit
that referenced
this issue
Apr 13, 2020
* remove the deprecated "Sourcegraph Internal" > "Gitserver" dashboard Before: 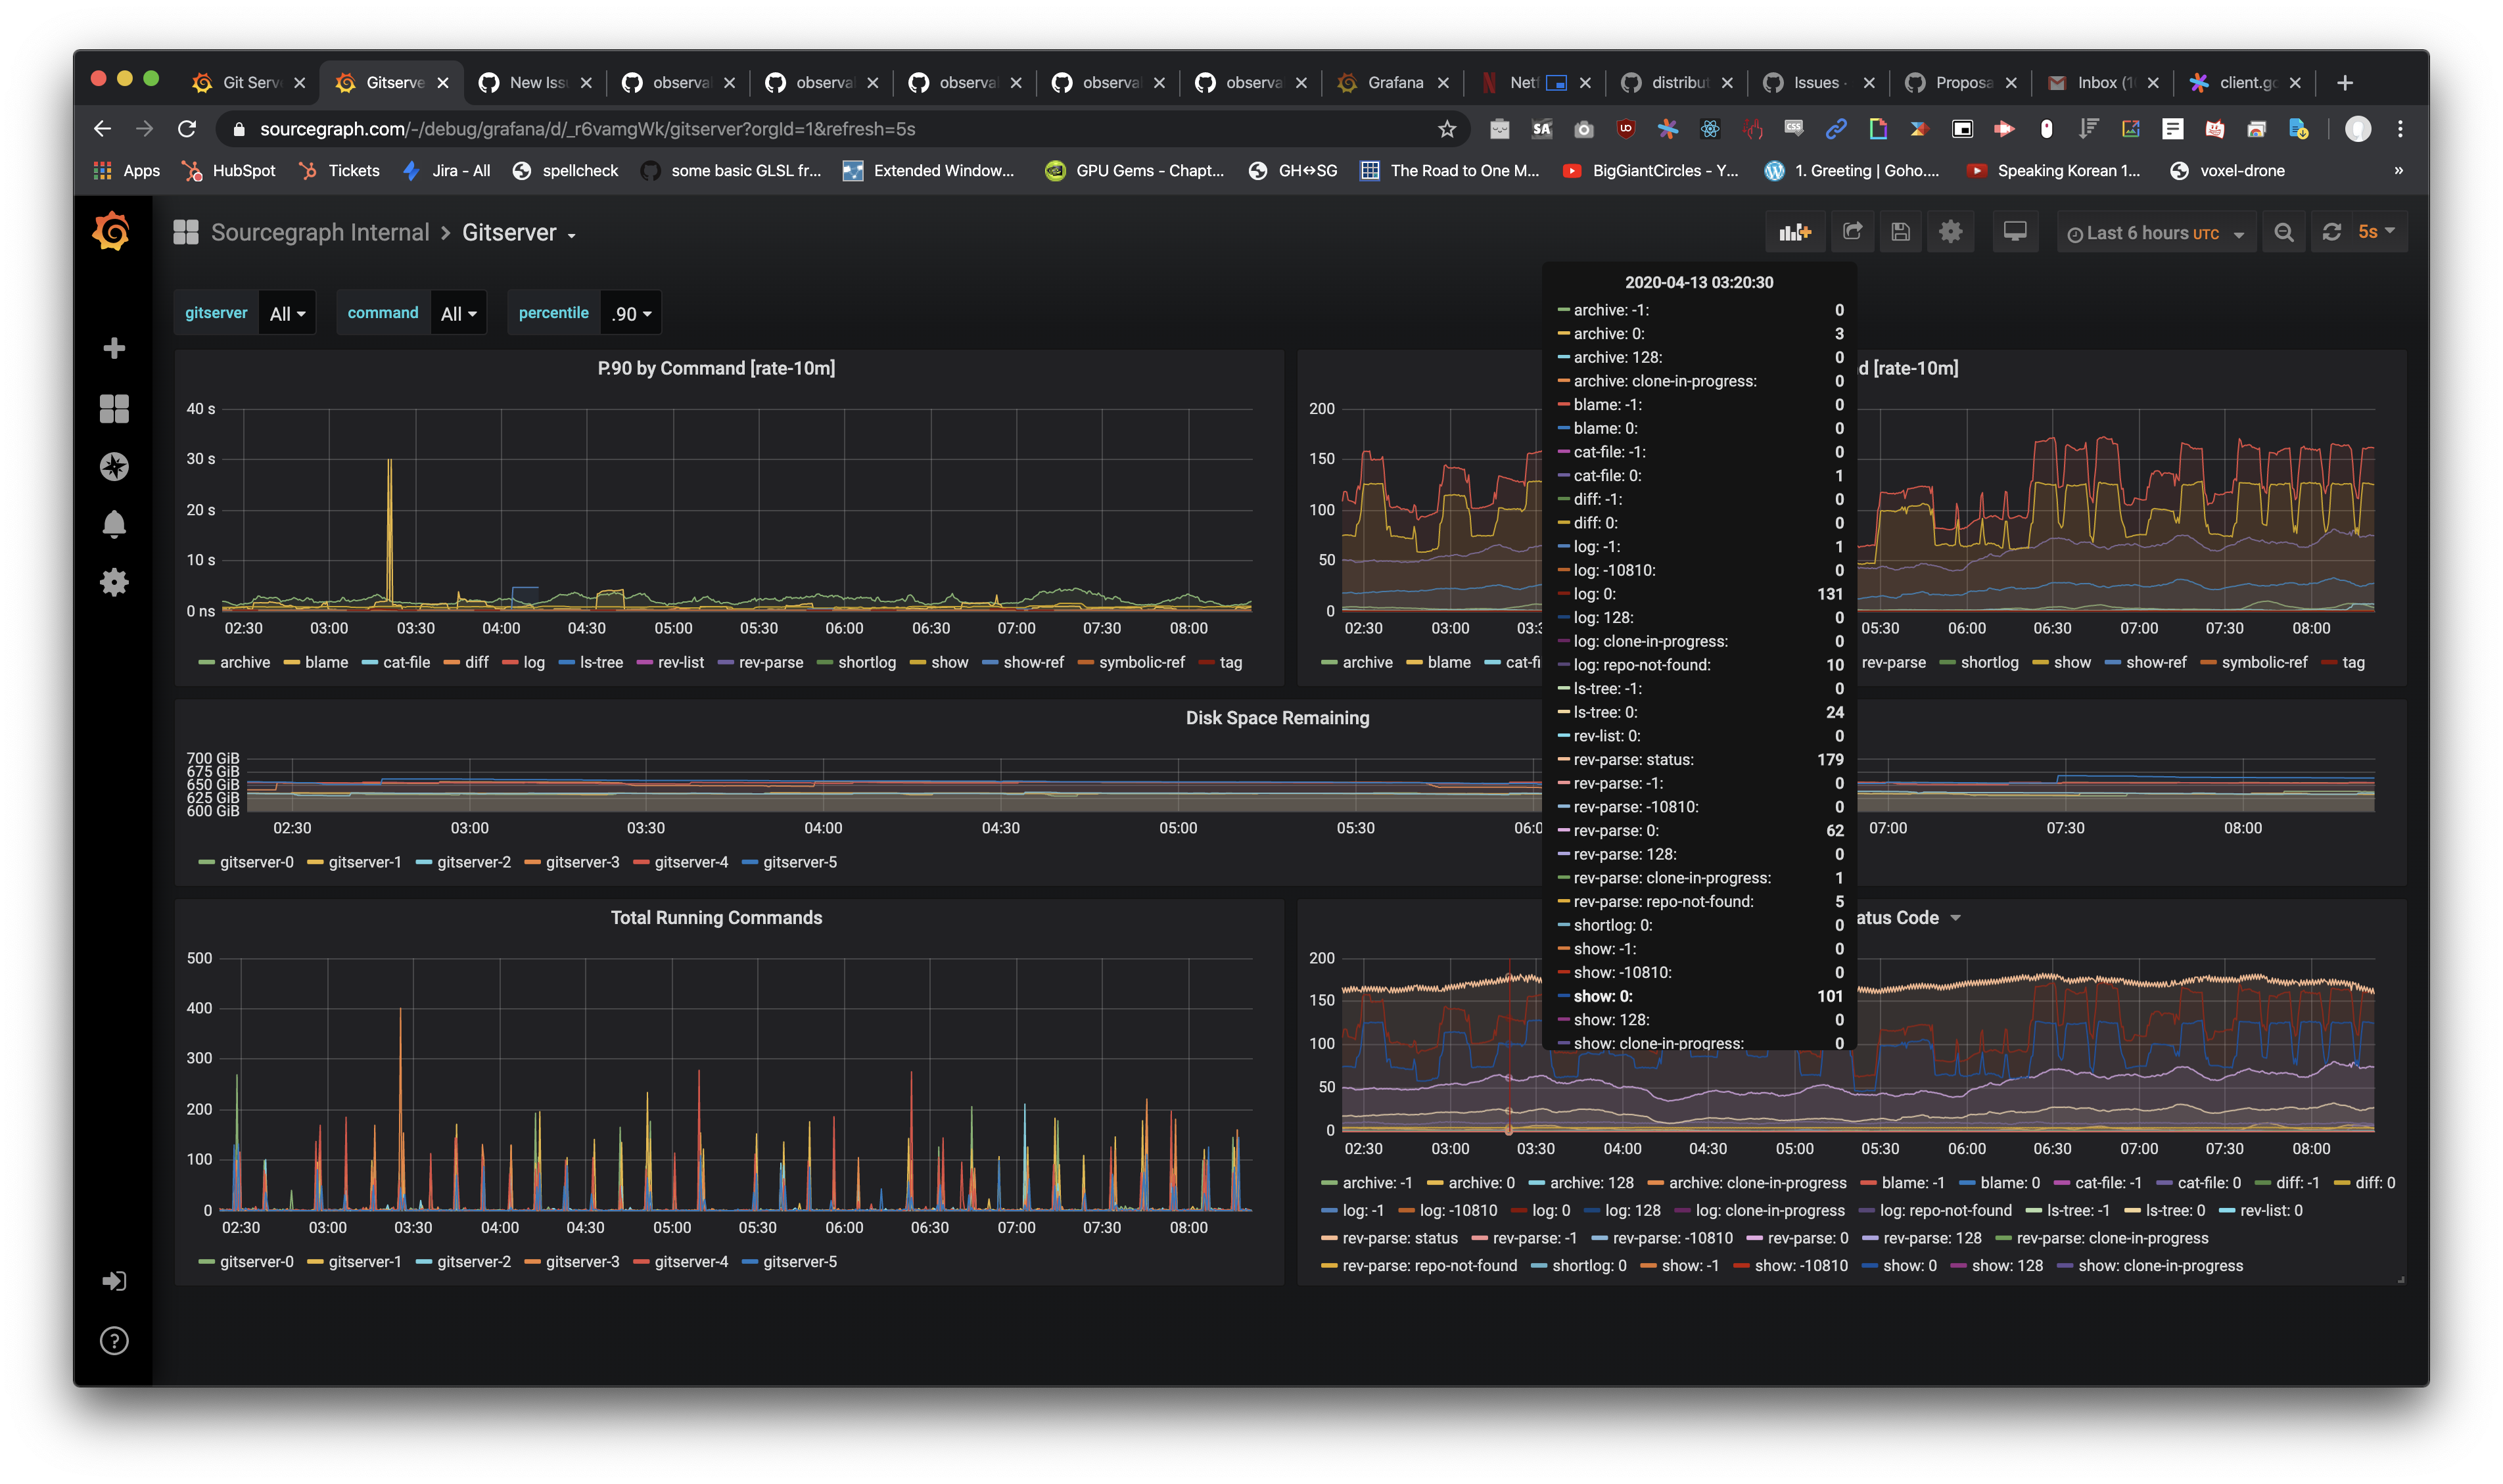 - `P.90 by command`: A by-command breakdown is not generally useful because gitserver command latency is mostly determined by other commands running on the system at the same time (so "latency per command" is not useful except for debugging Git's performance itself). #9788 exists to track monitoring latency of all commands. - `QPS by command` could be useful for debugging regressions or flaws that lead us to execute too many of the same command, but Jaeger is probably better suited for this and the query could be ran manually anyway. "Running git commands" already exists in new monitoring. - `Disk space remaining`: covered by new monitoring already, but only in percentages. Filed #9787 - `Total running commands`: covered already in new monitoring. * remove the deprecated "Sourcegraph Internal" > "Gitserver Rev 2" dashboard Before:  - `Deadline Exceeded Rate` MAY be a useful metric, but right now is far too high and random to give any useful information. Will revisit later: #9786 - `Clone Queue Size`: covered by new monitoring already. - `Available Disk Space`: covered by new monitoring already, but only in percentages. Filed #9787 - `Echo Duration Seconds`: covered by new monitoring already. - `Latencies for commands (seconds)`: this panel is currently misleading and broken because it operating on the rate of a bucket metric (???); filed #9788 - `Commands Running Concurrently`: covered by new monitoring already. - `Num repos waiting on git ls-remote`: This is a heavily misleading title (makes it sound like this blocks repo actions, which it does not); covered by new monitoring already. - `Repos Cloned Rate`: Covered more effectively by clone queue size in new monitoring. - `Repos Recloned Rate`: Not yet covered, filed #9789 - `Repos Removed Rate`: Not yet covered, filed #9790 * remove the deprecated "Sourcegraph Internal" > "Overview" dashboard Before:  - `QPS by Status Code`: too high level to be useful in any way, also very misleading because it doesn't account for the fact that 90% of our requests are GraphQL where an error is a 200. - `P.90 request duration`: Too much cardinality to be useful - `Memory usage [RSS]`: Arguably the most useful on this dashboard, but still too high cardinality to be useful; superseded by #9791 - `Container CPU [all cores]`: broken; superseded by #9791 * remove useless "Sourcegraph Internal" > "Zoekt Indexserver" dashboard Honestly, there is no way this dashboard could ever be useful to anyone. How would you interpret these numbers?  New monitoring already has in place alerting for revision resolution, and #9783 exists to track indexing failures (not covered by this dashboard). I am not convinced "Latencies for indexing a repo (seconds)" is a useful metric, currently, either. * remove deprecated "Sourcegraph internal" > "Searcher" dashboard Before: 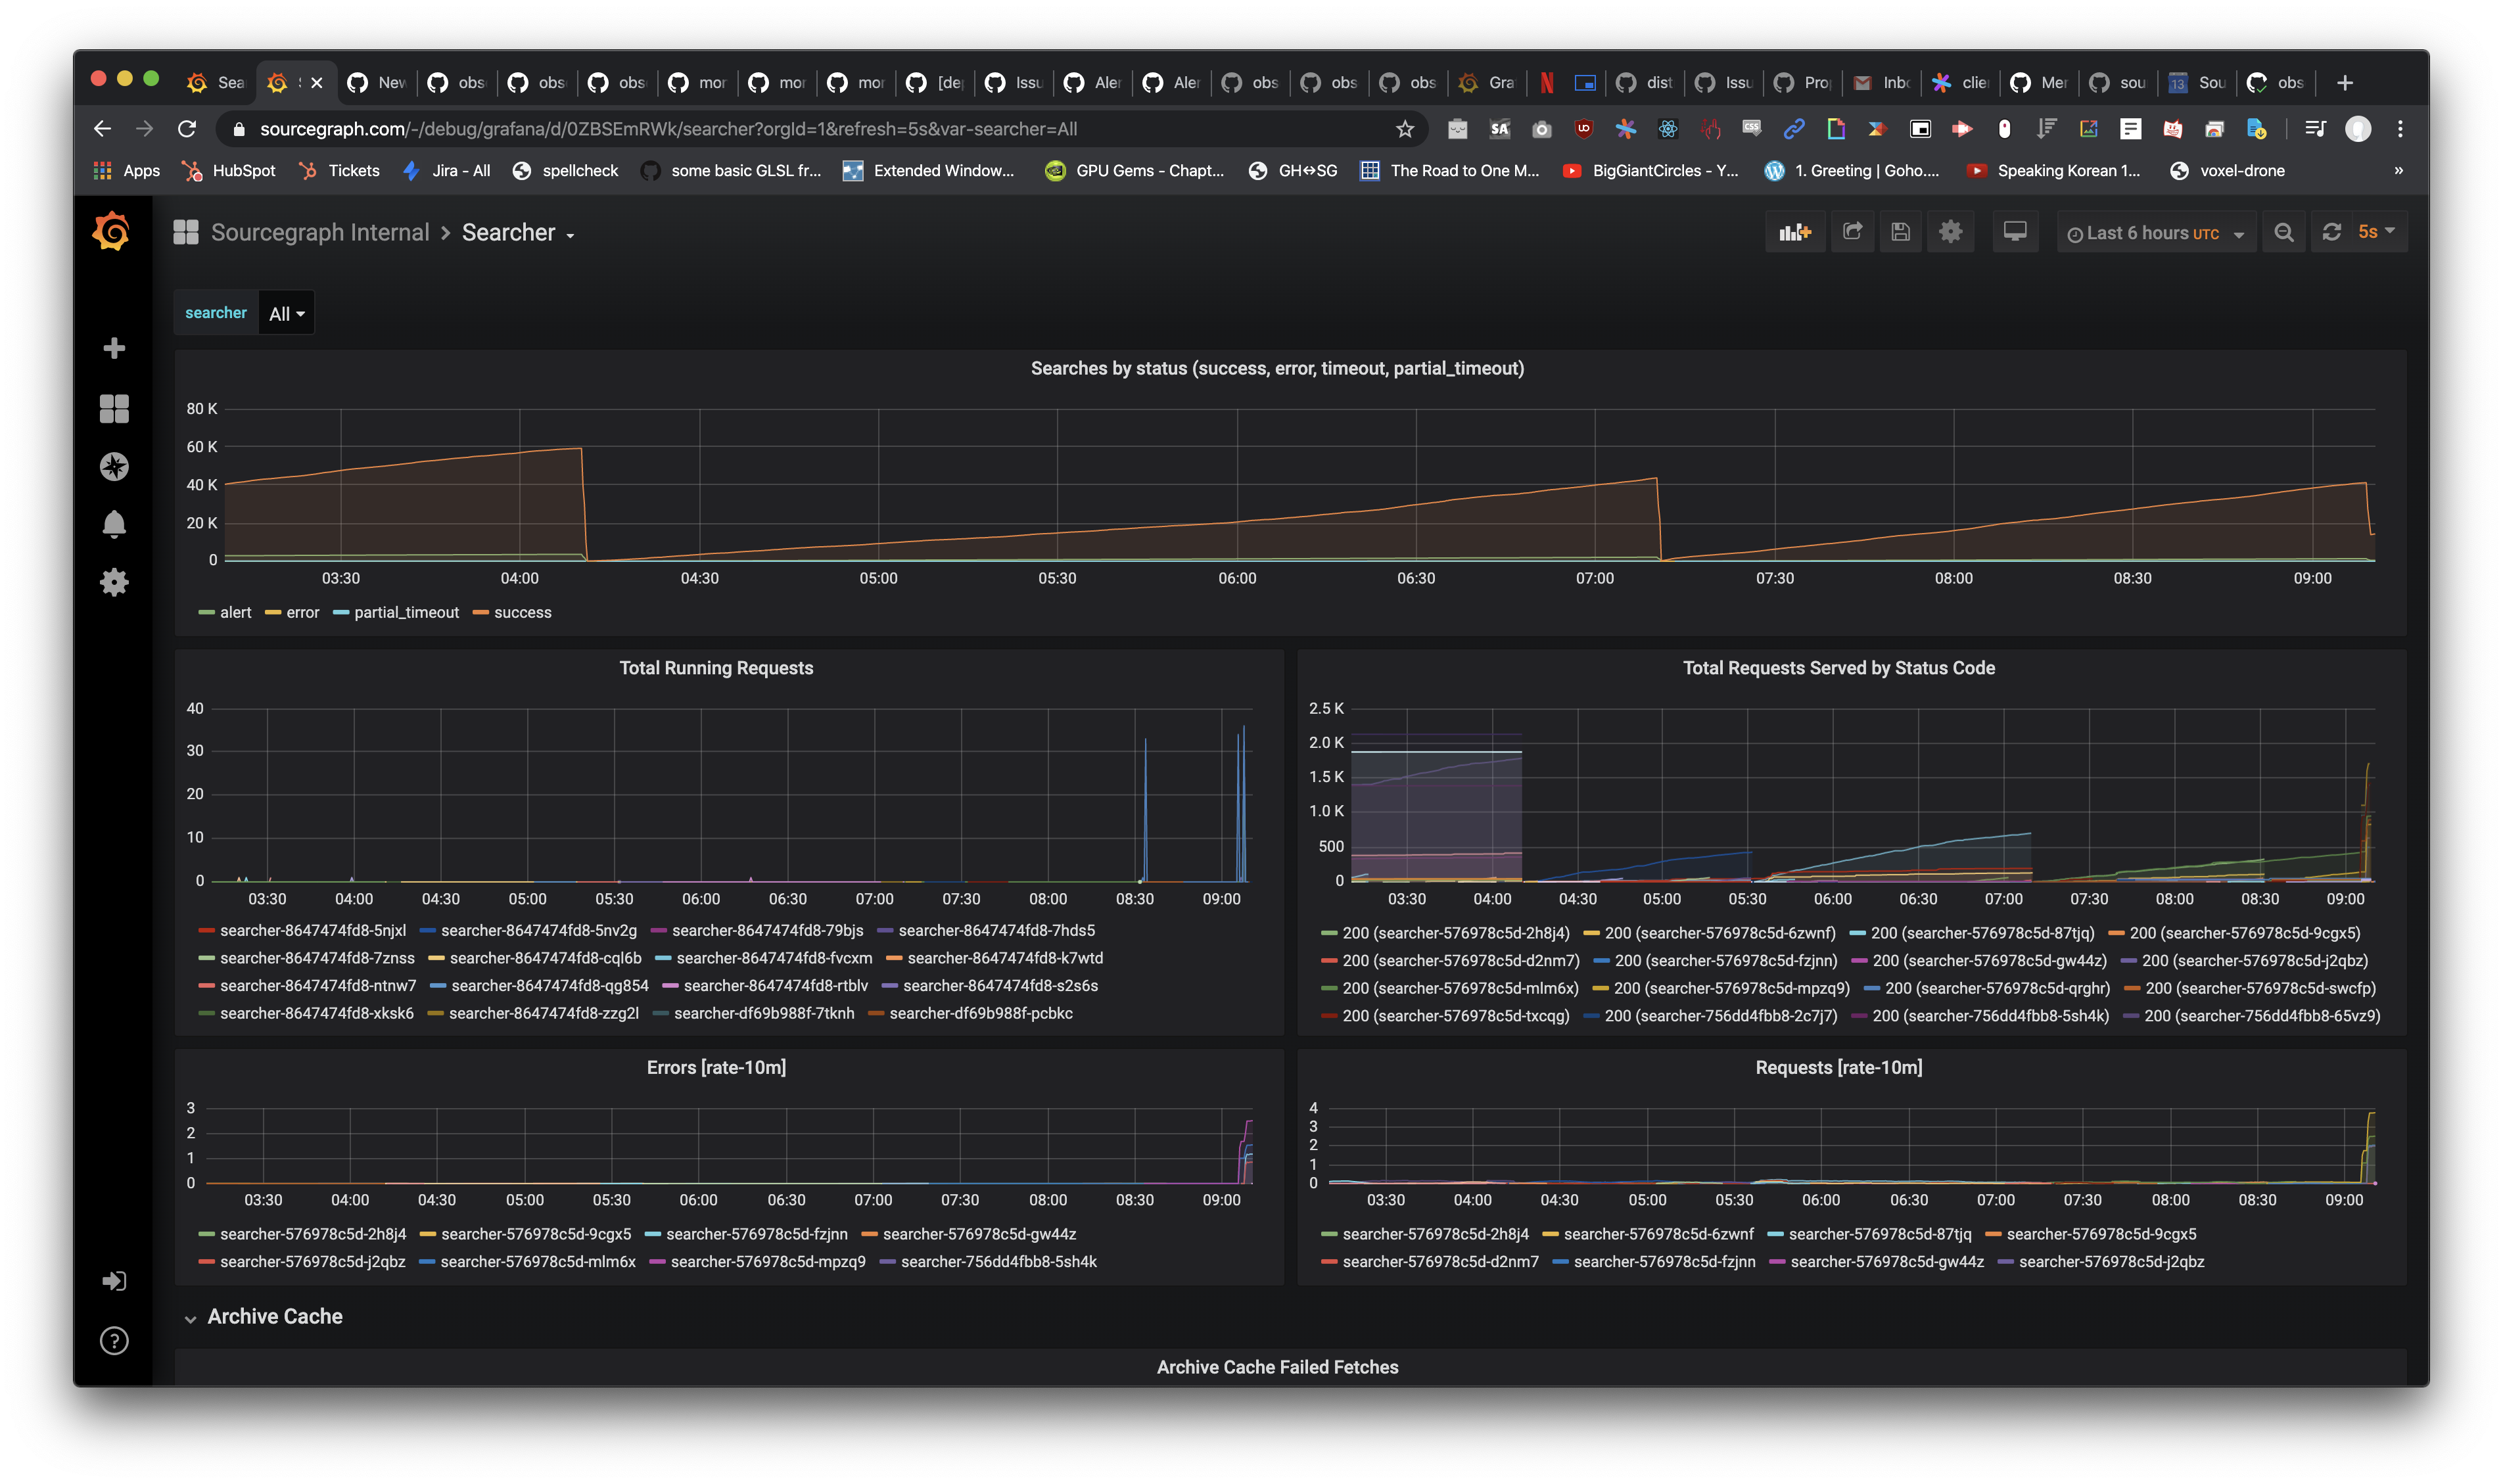 - `Searches by status ...`: covered by "Unindexed search request errors" in new monitoring. - `Total running requests`: not needed/useful - `Total requests served`: not needed/useful - `Errors [rate-10m]`: covered by "Unindexed search request errors" in new monitoring. - `Requests [rate-10m]`: not needed/useful - `Archive Cache ...`: Filed #9796 * remove obsolete "Sourcegraph Internal" > "HTTP" dashboard Before: 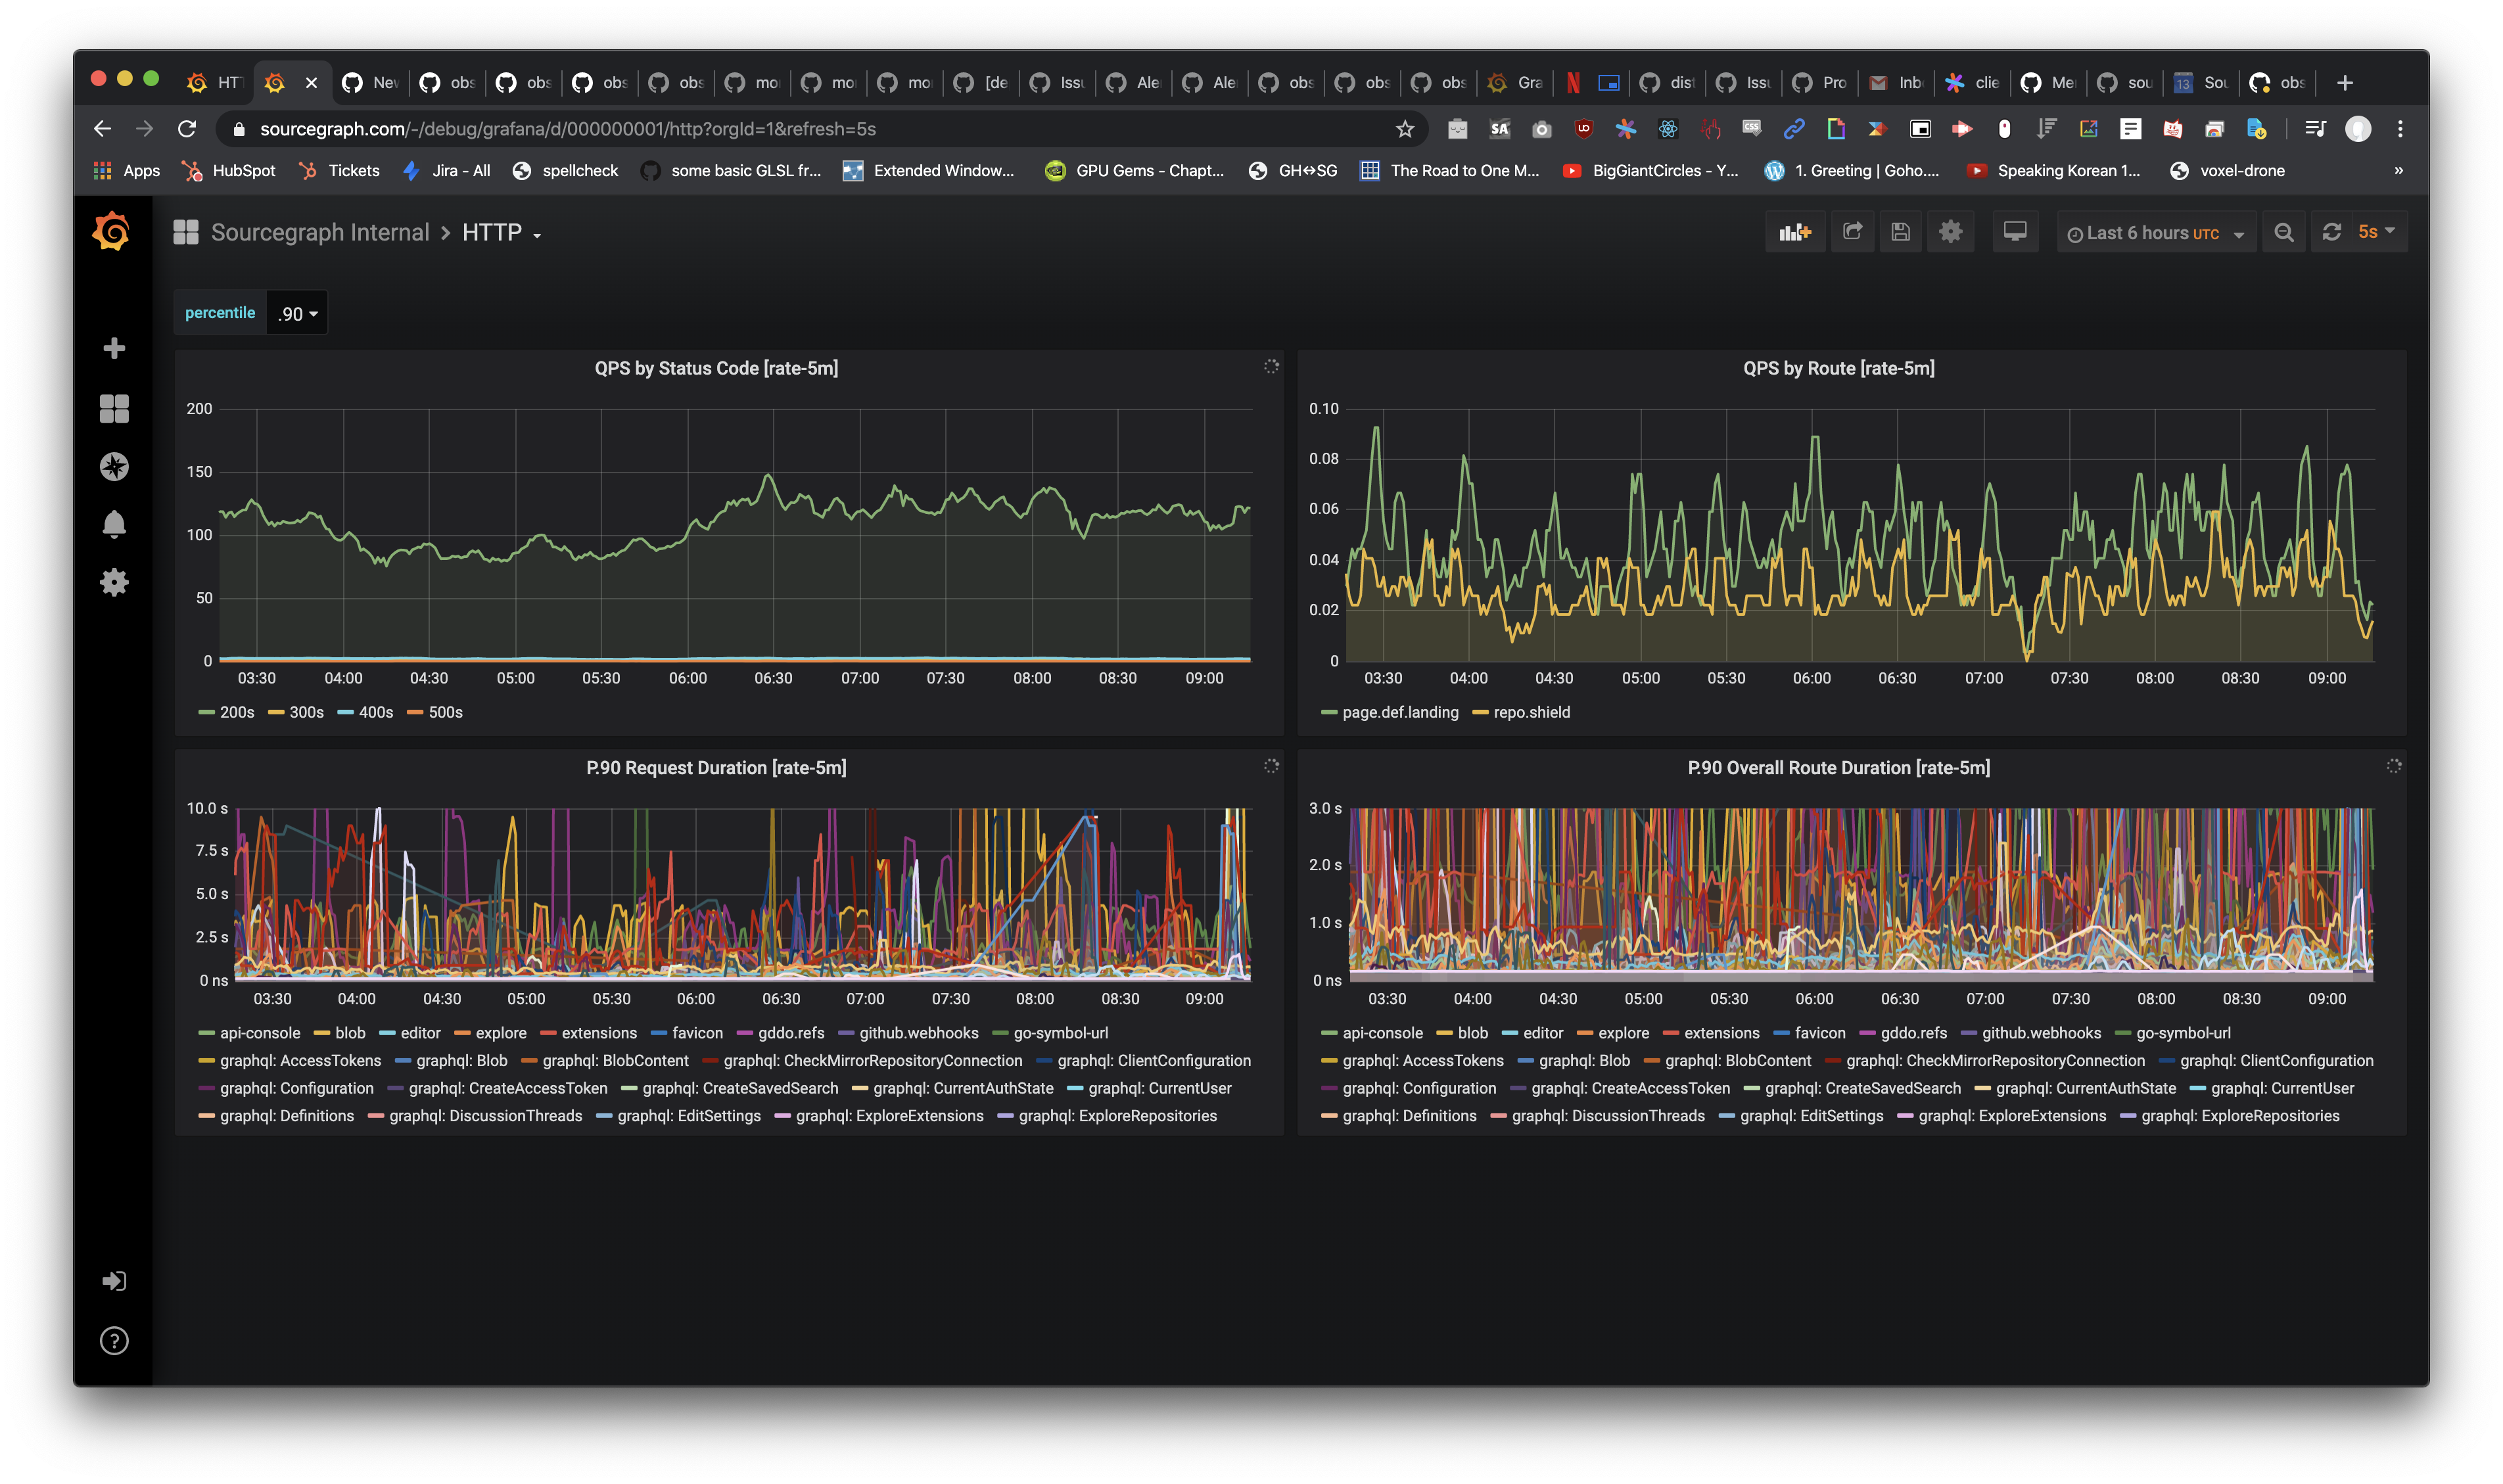 - `QPS by Status Code`: Not useful, most of our requests even GraphQL are 200-with-error. - `QPS by Route`: Not useful, as shown by screenshot. - `P.90 request duration`: Will be superseded by #9797 & currently not useful due to verbosity. - `P.90 Overall Route Duration`: Confusing with above; Will be superseded by #9797 & currently not useful due to verbosity.
22 tasks
OLD - Distribution - use "Distribution 🚢"
automation
moved this from Medium priority
to Done
May 26, 2021
Sign up for free
to join this conversation on GitHub.
Already have an account?
Sign in to comment
We have a metric in
gitserver,src_gitserver_repos_recloned, which would warn us if Sourcegraph is trying to perform a mass-reclone of all repositories.We should add this and alerts to the gitserver dashboard / monitoring stack, as this has caused major issues in the past for customers and gone unnoticed.
The text was updated successfully, but these errors were encountered: