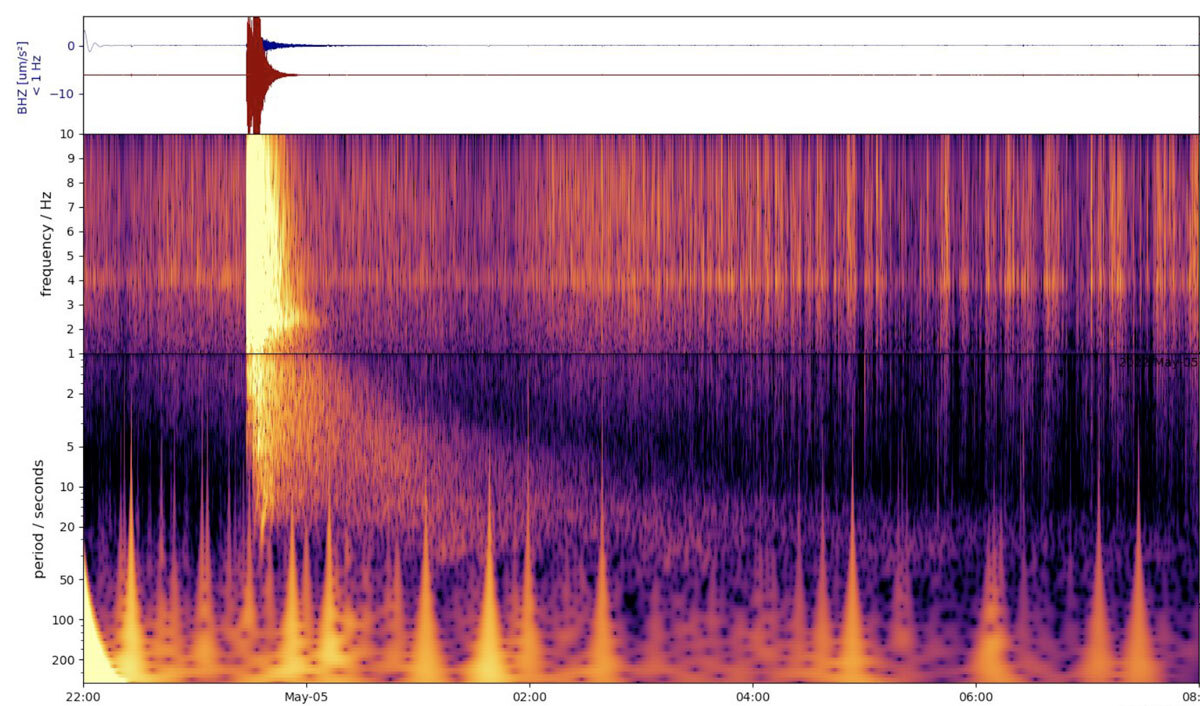
Plot clean spectrograms of longer seismic time series
As usual, it's easiest to use anaconda. If you already have an environment with the typical seismology packages
    matplotlib
    numpy
    obspy
    python
    scipy
    cartopy
installed, you're set. Otherwise, create yourself an environment with
conda env create -f dailyspec.yml
conda activate dailyspec
pip install -e .This command
python -m dailyspec.plot_spec \
--w0 24 -d ./S1022a/XB.ELYSE.02.BHZ \
--winlen 500  --fmax 10 --plot_ratio 0.6  --kind cwt \
--tstart 2022-05-04T22:00 --tend 2022-05-05T08:00 -h
will give you the spectrogram of the S1222a magnitude 5 marsquake, which was featured in NASA's press release on the
event.

(the seismogram data will be released on October 1st 2022)
Dailyspec can also process a full directory of waveform data that is in a SeisComp3 directory structure and produce a simple web catalog from it.
python -m dailyspec.process_dir
       -d /data/sc3data/op/data/waveform/  # Path to SC3 directory with waveforms
       -c events.xml                       # Path to QuakeML file with events to mark
       -i inventory.xml                    # StationXML file
       --year 2020                         # Restrict to a given year
       --jday_start 1 --jday_end 30        # Restrict to days of year
       -l channels.txt                     # List of SEED channel IDs
       --fmax 10                           # Maximum frequency for HF plot
       --winlen 3600                       # Window length for LF plot (1/fmin)
       --kind cwt                          # Use spectrogram (fast) or CWT (slower)
       --dBmin -70 --dBmax -10             # Dynamic range of colorscale
       -r 0.8                              # Percentage of plot space for the LF plot
This produces 2 directories by_channel and by_day, in which you find spectrograms for each channel on each day
sorted,
with a HTML file to parse them quickly.
You can make the spectrogram easier to interpret by adding markers for known earthquakes. For that, downlad a QuakeML
file first and hand it to dailyspec.process_dir or dailyspec.plot_spec with argument -c.
Download a QuakeML file with minimum magnitude increasing in circles around a given station (or lat/lon pair) using
dailyspec.get_events
python -m dailyspec.get_events
       -s CH.HASLI..HHZ          # Channel snippet to center event set around
       -i swiss_station/CH.xml   # StationXML file to get channel lat/lon from
       --tstart 20220101         # Start of catalog
       --tend 20221231           # End of catalog
       --dists 5 30 180          # Maximum distance of bins, here 5°, 30° and 180°
       --min_mags 1.5 5.0 7.0    # Download all events >1.5 until 5°, all >5 until 30° and all >7 anywhere
This produces a file events.xml, which you can pass to the plotting codes.