The VS Code team at Microsoft recommends using @vscode/test-electron and @vscode/test-web for testing extensions. These packages allow you to run Mocha tests inside the extension host, which gives you access to the VSCode API to trigger certain events and automate VS Code to a certain extent. This will work for you as long as you are only interested in running simple unit and integration tests. However if your extension uses webviews and offers complex user interfaces you might want to consider using WebdriverIO and its VS Code plugin service for e2e testing.
With WebdriverIO you can automate VS Code like any other Electron or web application. It offers some neat features similar to the packages mentioned above but goes beyond just automating VS Code through its API. The WebdriverIO service helps you to get up and running seamlessly by:
- 🏗️ Installing VS Code (either stable, insiders or a specified version)
- ⬇️ Downloading Chromedriver specific to given VS Code version
- 🚀 Enables you to access the VS Code API from your tests
- 🖥️ Starting VS Code with custom user settings (including support for VS Code on Ubuntu, MacOS and Windows)
- 🌐 Or serves VS Code from a server to be accessed by any browser for testing web extensions
- 📔 Bootstrapping page objects with locators matching your VS Code version
With this you can run your unit and integration tests by accessing the VS Code APIs and at the same time automate VS Code to test any complex user flows or webviews in one single test framework.
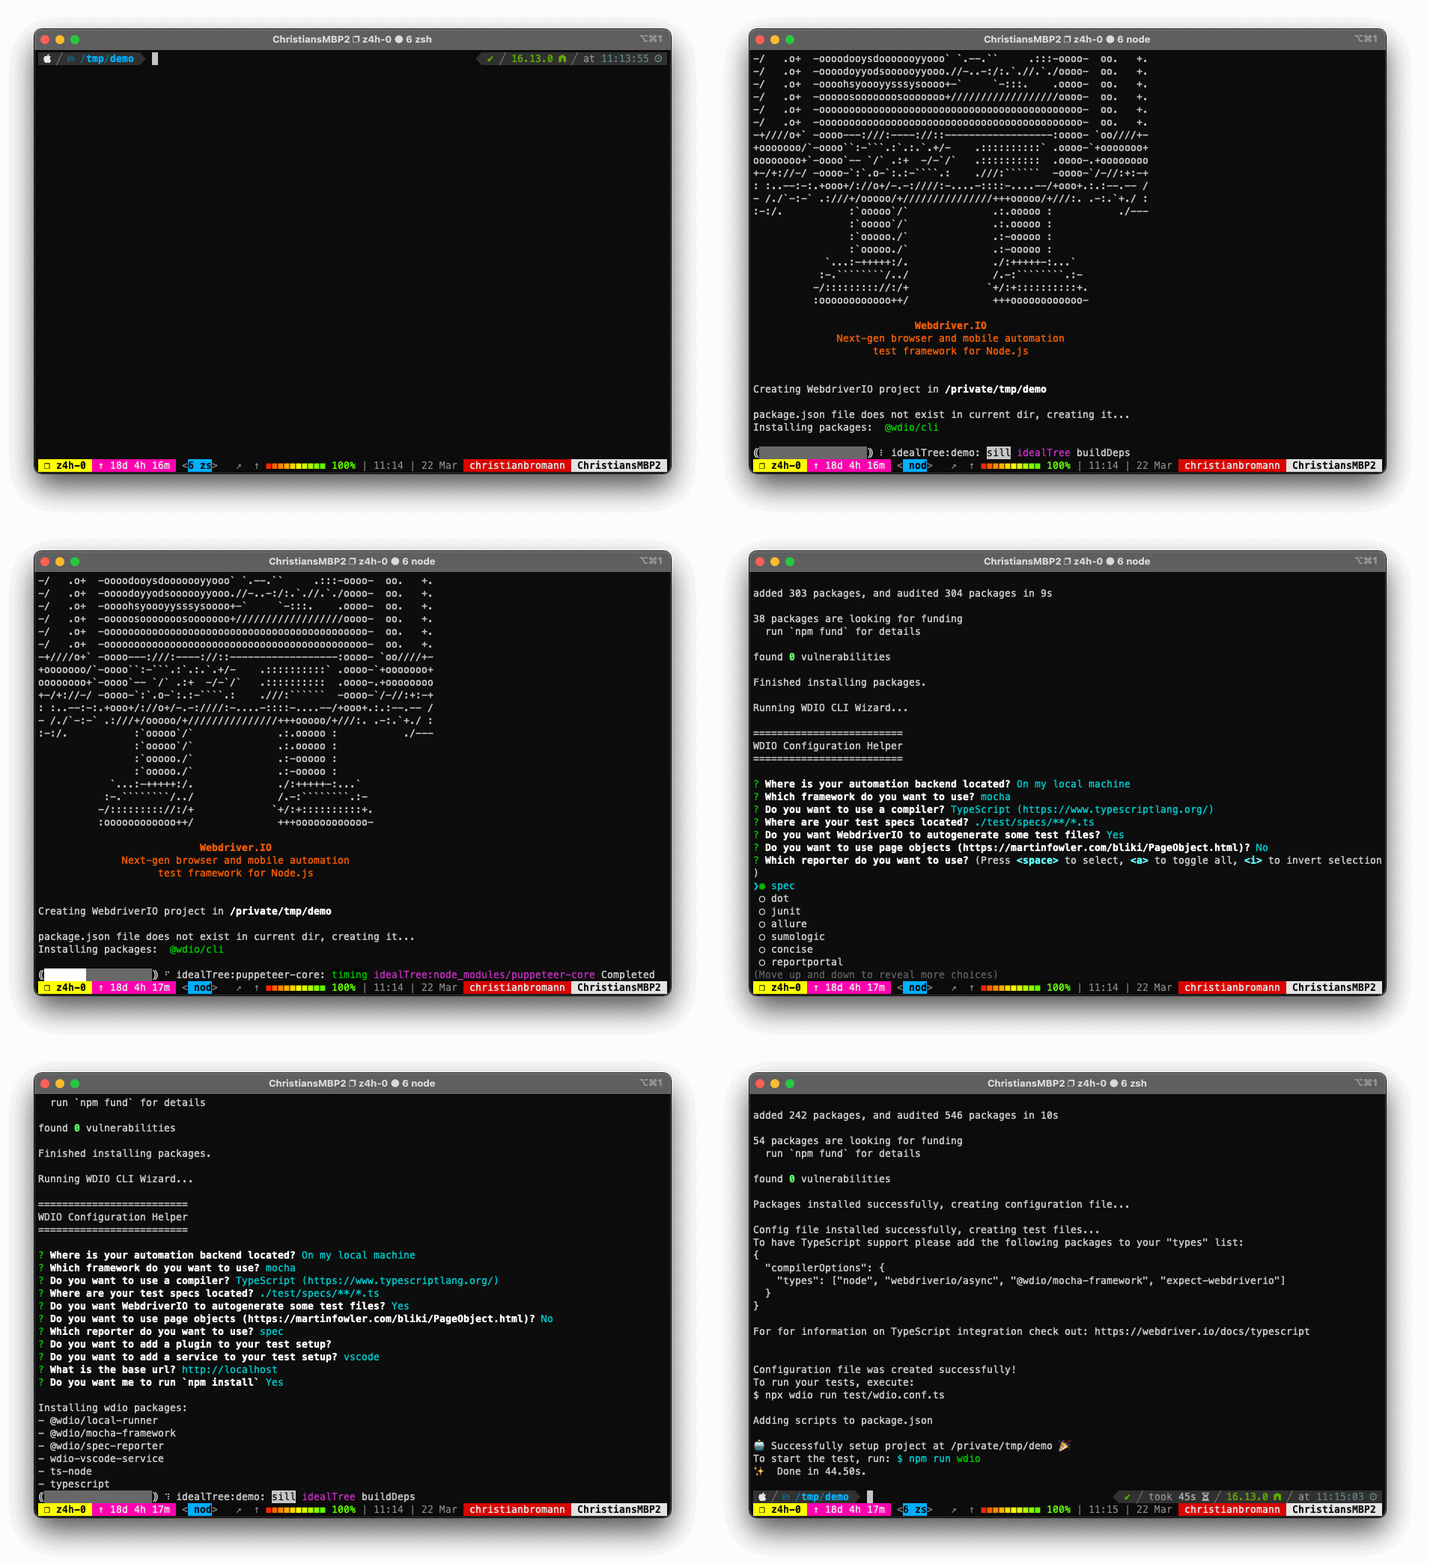
To start testing your extension project using WebdriverIO, we have to set up our project by running:
npm create wdio ./An installation wizard will guide you through the process. Ensure you select TypeScript as compiler and don't have it generate page objects for you given this project comes with all page objects needed. Then make sure to select vscode within the list of services:
After the wizard has installed all required NPM packages, you should see a wdio.conf.ts in the root directory of your project. Open the file and update the capabilities property to this:
import path from 'path'

// test/wdio.conf.ts
export const config = {
    // ...
    capabilities: [{
        browserName: 'vscode',
        browserVersion: 'stable',
        'wdio:vscodeOptions': {
            // point to the root directory of your project
            extensionPath: path.join(__dirname, '..'),
        }
    }],
    // ...
};
This will tell WebdriverIO to download and set up VS Code stable for you. You can also pick any arbitrary version VS Code has released or insiders. Lastly, let's create a demo test to print the application title, e.g.:
// test/specs/demo.test.ts
describe('My VS Code Extension', () => {
    it('should be able to load VS Code', async () => {
        const workbench = await browser.getWorkbench()
        expect(await workbench.getTitleBar().getTitle())
            .toBe('[Extension Development Host] Visual Studio Code')
    })
})
Now you can run your tests by calling:
npx wdio run wdio.conf.tsAwesome 🎉 Our first demo test just successfully passed. Let's test our actual extension.
VS Code is a complex web application that changes everytime a new release is pushed to public. To avoid having to update tests the service offers a broad set of page objects to interact with VS Code elements. Page Objects are a test design pattern that tries to abstract away the interaction with an application into a class. It makes your tests more readable and easier to maintain as all details about a view or component are located in a dedicated page object.
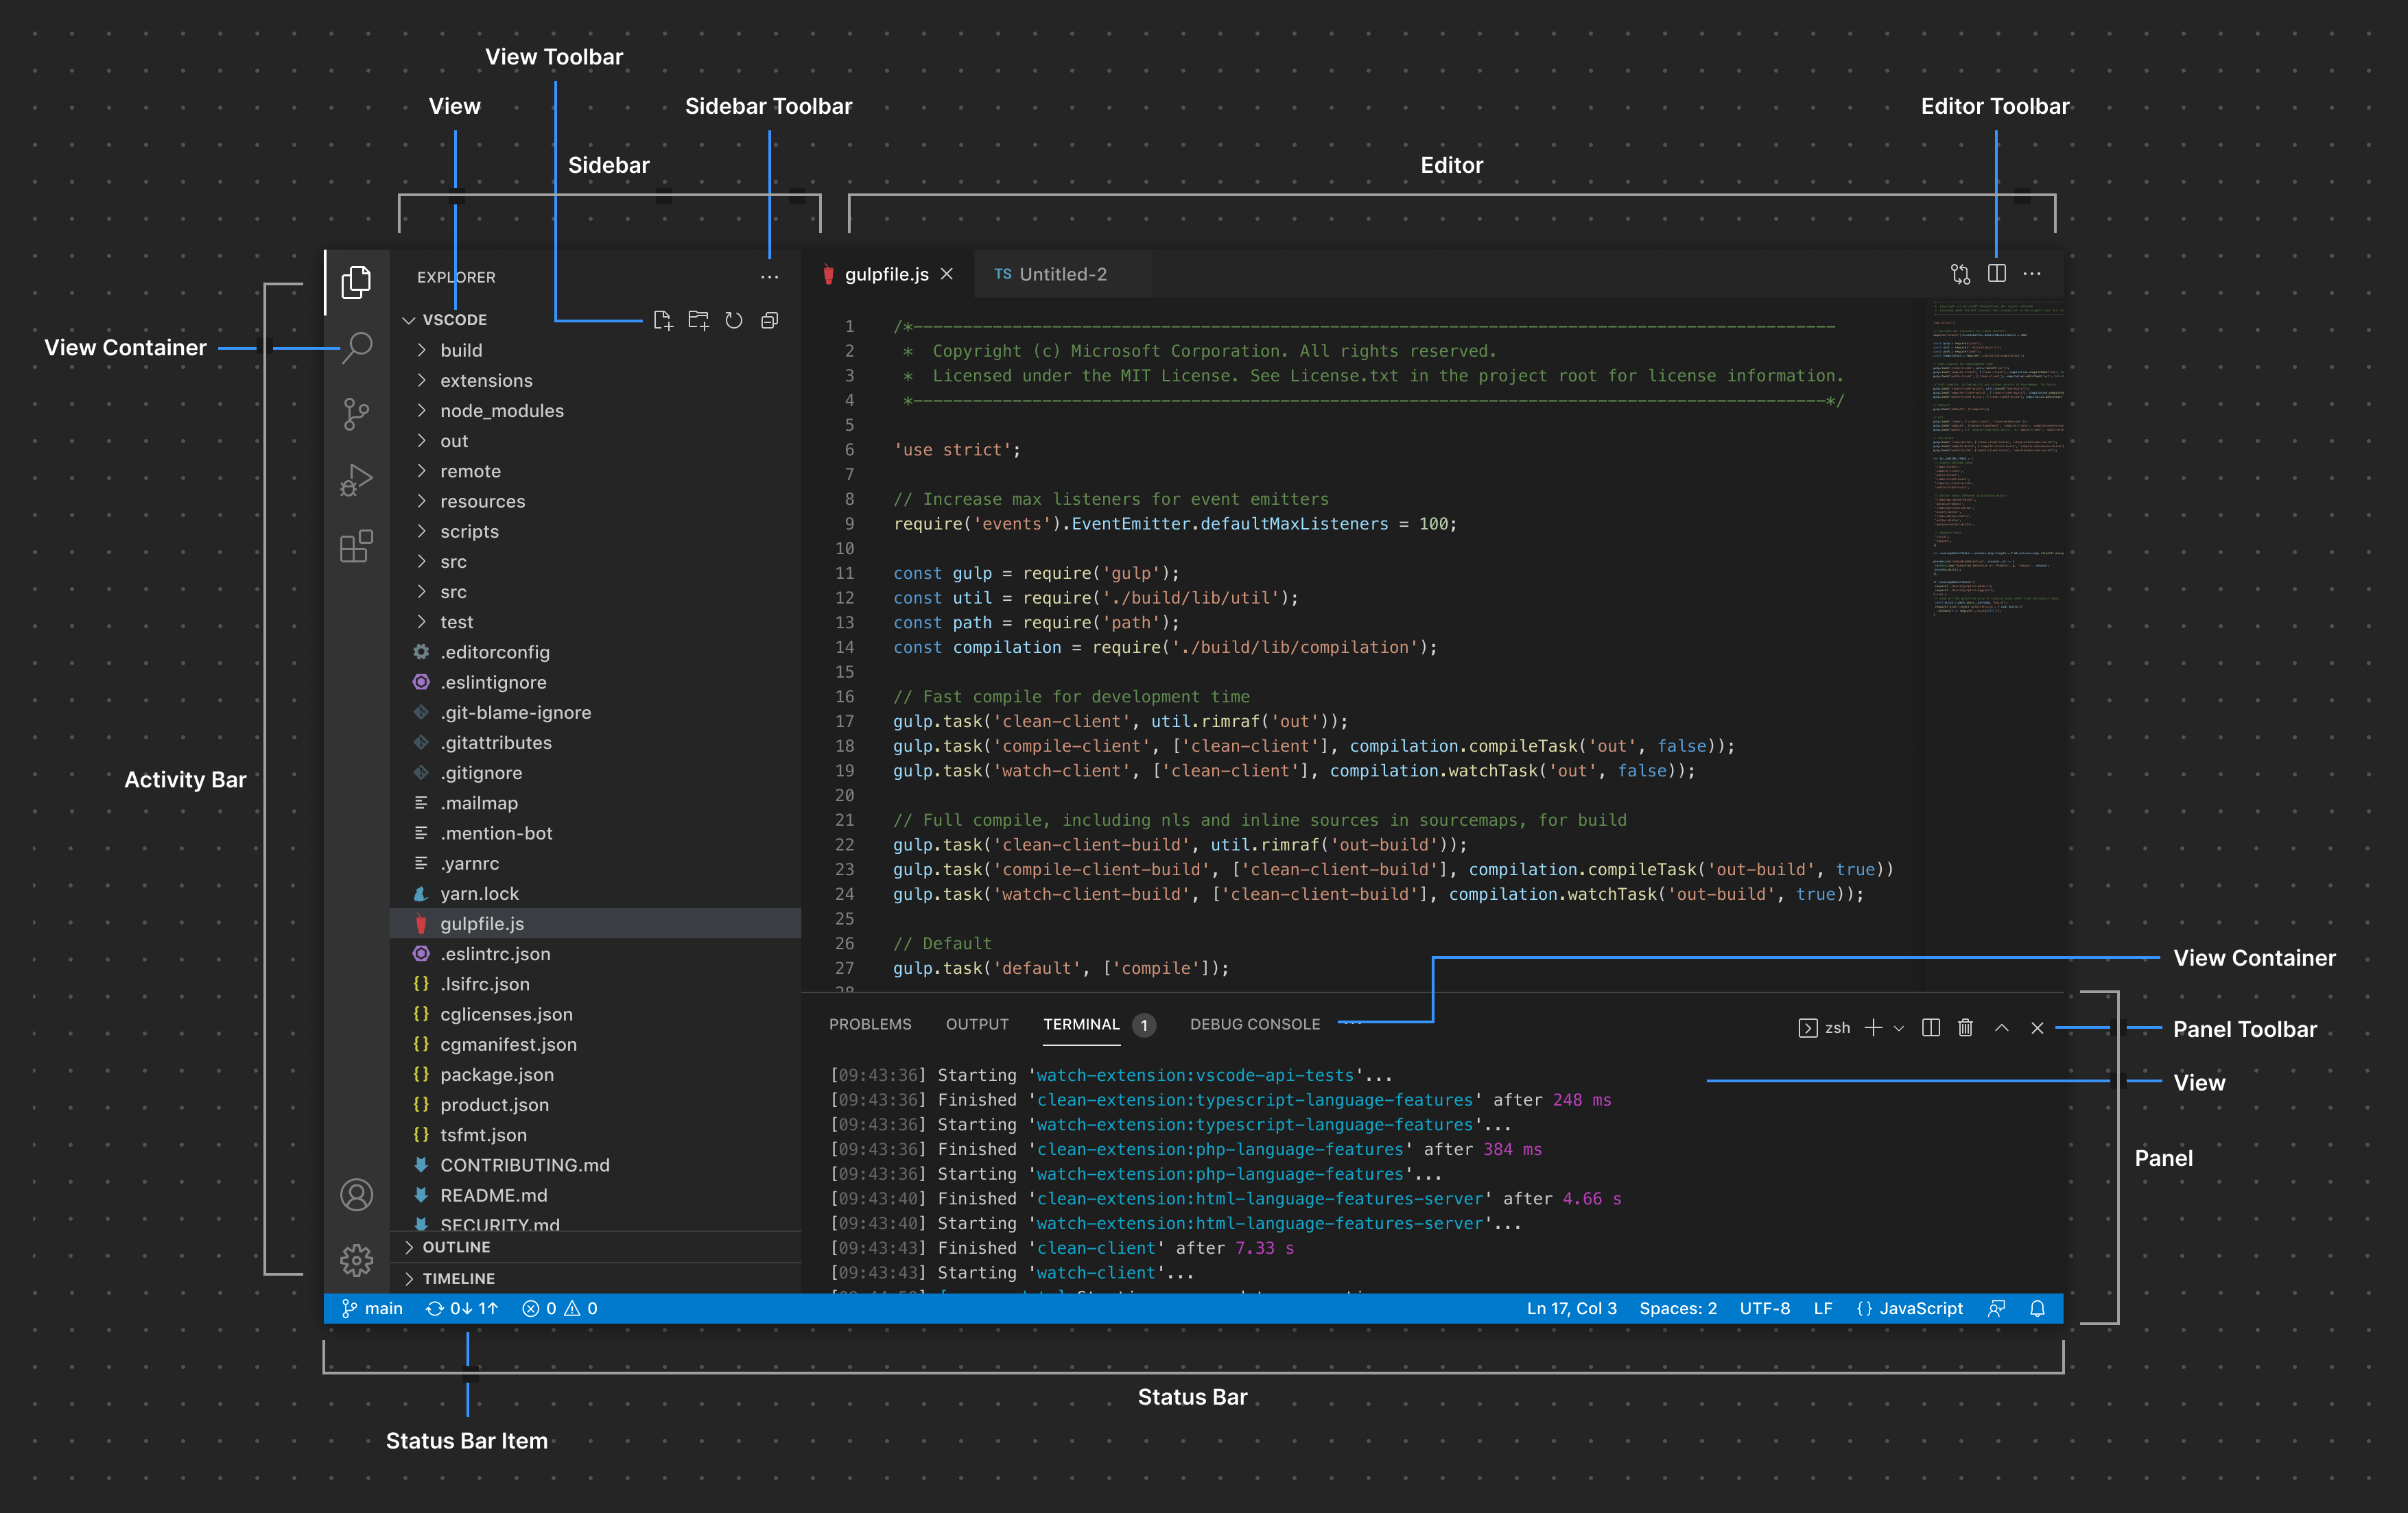
If you take a look at the VS Code architecture you can see that the application can be separated into various sections:
The page objects that come with the test framework provide interfaces to interact with all these sections. You can get access to it by calling the browser.getWorkbench() command which gives you the main page object for the VS Code workbench. From there you can get access to the activity, status and title bar as well as to webviews and notifications. You can find a detailed description of all interfaces in the service documentation.
Testing vscode-awesome-ux
In our demo extension we provide 3 webviews, two within the sidebar panel and one editor webview. It shows how UI interactions are synced across all webviews using a tool called tangle.
In order to test this we have to be able to automate these webviews and switch around to ensure updates are synced among them. For that we can use the getAllWebViews method of the workbench page object. Given that webviews live within an iframe we have to switch the WebDriver context to access the elements within. For that the webview page object offers an open method. From there on we can use CSS selectors to fetch and interact with the elements within our webview, e.g.:
const workbench = await browser.getWorkbench();
const webviews = await workbench.getAllWebviews();

await webviews[0].open();
await $('>>>vscode-button').click()
The above example shows how to open the first webview in our sidebar and click on a web-component called vscode-button from the Webview UI Toolkit for Visual Studio Code using WebdriverIOs deep selector. At the end we can run the following test with assertions to check whether ringing the bell in our webview has also been triggered in the others:
describe('VS Code Awesome UX', () => {
    it('can interact with the webview in the sidebar', async () => {
        const workbench = await browser.getWorkbench();
        const webviews = await workbench.getAllWebviews();

        await webviews[0].open();
        await expect($('>>>vscode-badge')).toHaveText('0');
        await $('>>>vscode-button').click();
        await expect($('>>>vscode-badge')).toHaveText('1');
        await webviews[0].close();
    })

    it('has updated ring count in other sidebar webview', async () => {
        const workbench = await browser.getWorkbench();
        const webviews = await workbench.getAllWebviews();

        await webviews[1].open();
        await expect($('>>>vscode-badge')).toHaveText('1');
        await webviews[1].close();
    })

    it('has updated ring count in editor webview', async () => {
        const workbench = await browser.getWorkbench();
        const webviews = await workbench.getAllWebviews();

        await webviews[2].open();
        await expect($('>>>vscode-badge')).toHaveText('1');
        await webviews[2].close();
    })
})
In order to simplify the test we can abstract away some of that open and close interaction as well as the selectors in our own extension page object. Check out the full test suite for the VS Code Awesome UX Extension in its repository.
Similar to @vscode/test-electron to you can also use VS Code APIs to trigger certain events or automate actions within VS Code. It is often more efficient to use the API than triggering the same via WebDriver automation, especially when fetching data or e.g. code within the editor. By running the executeWorkbench command you can run a function within the extension host that has access to the vscode interface, e.g.:
const workbench = await browser.getWorkbench()
await browser.executeWorkbench((vscode, param1, param2) => {
    vscode.window.showInformationMessage(`I am an ${param1} ${param2}!`)
}, 'API', 'call')

const notifs = await workbench.getNotifications()
console.log(await notifs[0].getMessage()) // outputs: "I am an API call!"
As can you see above the executeWorkbench callback has the vscode interface as first parameter, followed by arbitrary arguments passed in to the command. The example shows how you can trigger a notification message and fetch its content using the service page objects.
To ensure that our extension works all the time we should run our tests for every pull requests or commit made in our repository. To allow VS Code to start in a CI/CD environment we need to enable xvfb. With GitHub Actions this can be as simple as:
name: Extension Tests
on: [push]

jobs:
  build:
    runs-on: macos-latest
    steps:
      - uses: actions/checkout@v2
      - uses: actions/setup-node@v2
        with:
          node-version: 16
      - run: yarn
      - run: yarn build
      - name: Run tests
        uses: GabrielBB/xvfb-action@v1.0
        with:
          run: npx wdio run ./test/wdio.conf.ts
Check out this test pipeline in action for the VS Code Awesome UX Extension in its repository.
Many VS Code extensions in the marketplace are tested either not at all or very frugal. The tooling recommended in the VS Code documentation has shown to offer limited automation capabilities needed to properly test the correct usage of the VS Code APIs and all developer workflows. As more and more VS Code extensions become critical building blocks to our developer experience, extension authors should ensure that new extension releases don't break that experience and the developer productivity overall.
While mostly unit and integration tests should cover most of the issues that might arise, a small set of e2e tests can help us to detect if configuration and usage of used VS Code APIs are correct and that the value an extension offers works from end to end. WebdriverIO with its VS Code testing service provides extension developers an all in one solution to run all of the tests efficiently on your local machine or in CI/CD.


