Types of Monitoring
You can monitor your application by using a simple HTTP GET to the endpoint to return back a response and status code. Normally you want a 200 status code on an HTTP request. You might want to require a 404 or 500 error as a response code though. With each service you can include a Timeout in seconds to work with your long running services.
For more advanced monitoring you can add a data as a HTTP POST request. This is useful for automatically submitting JSON, or making sure your signup form is working correctly.
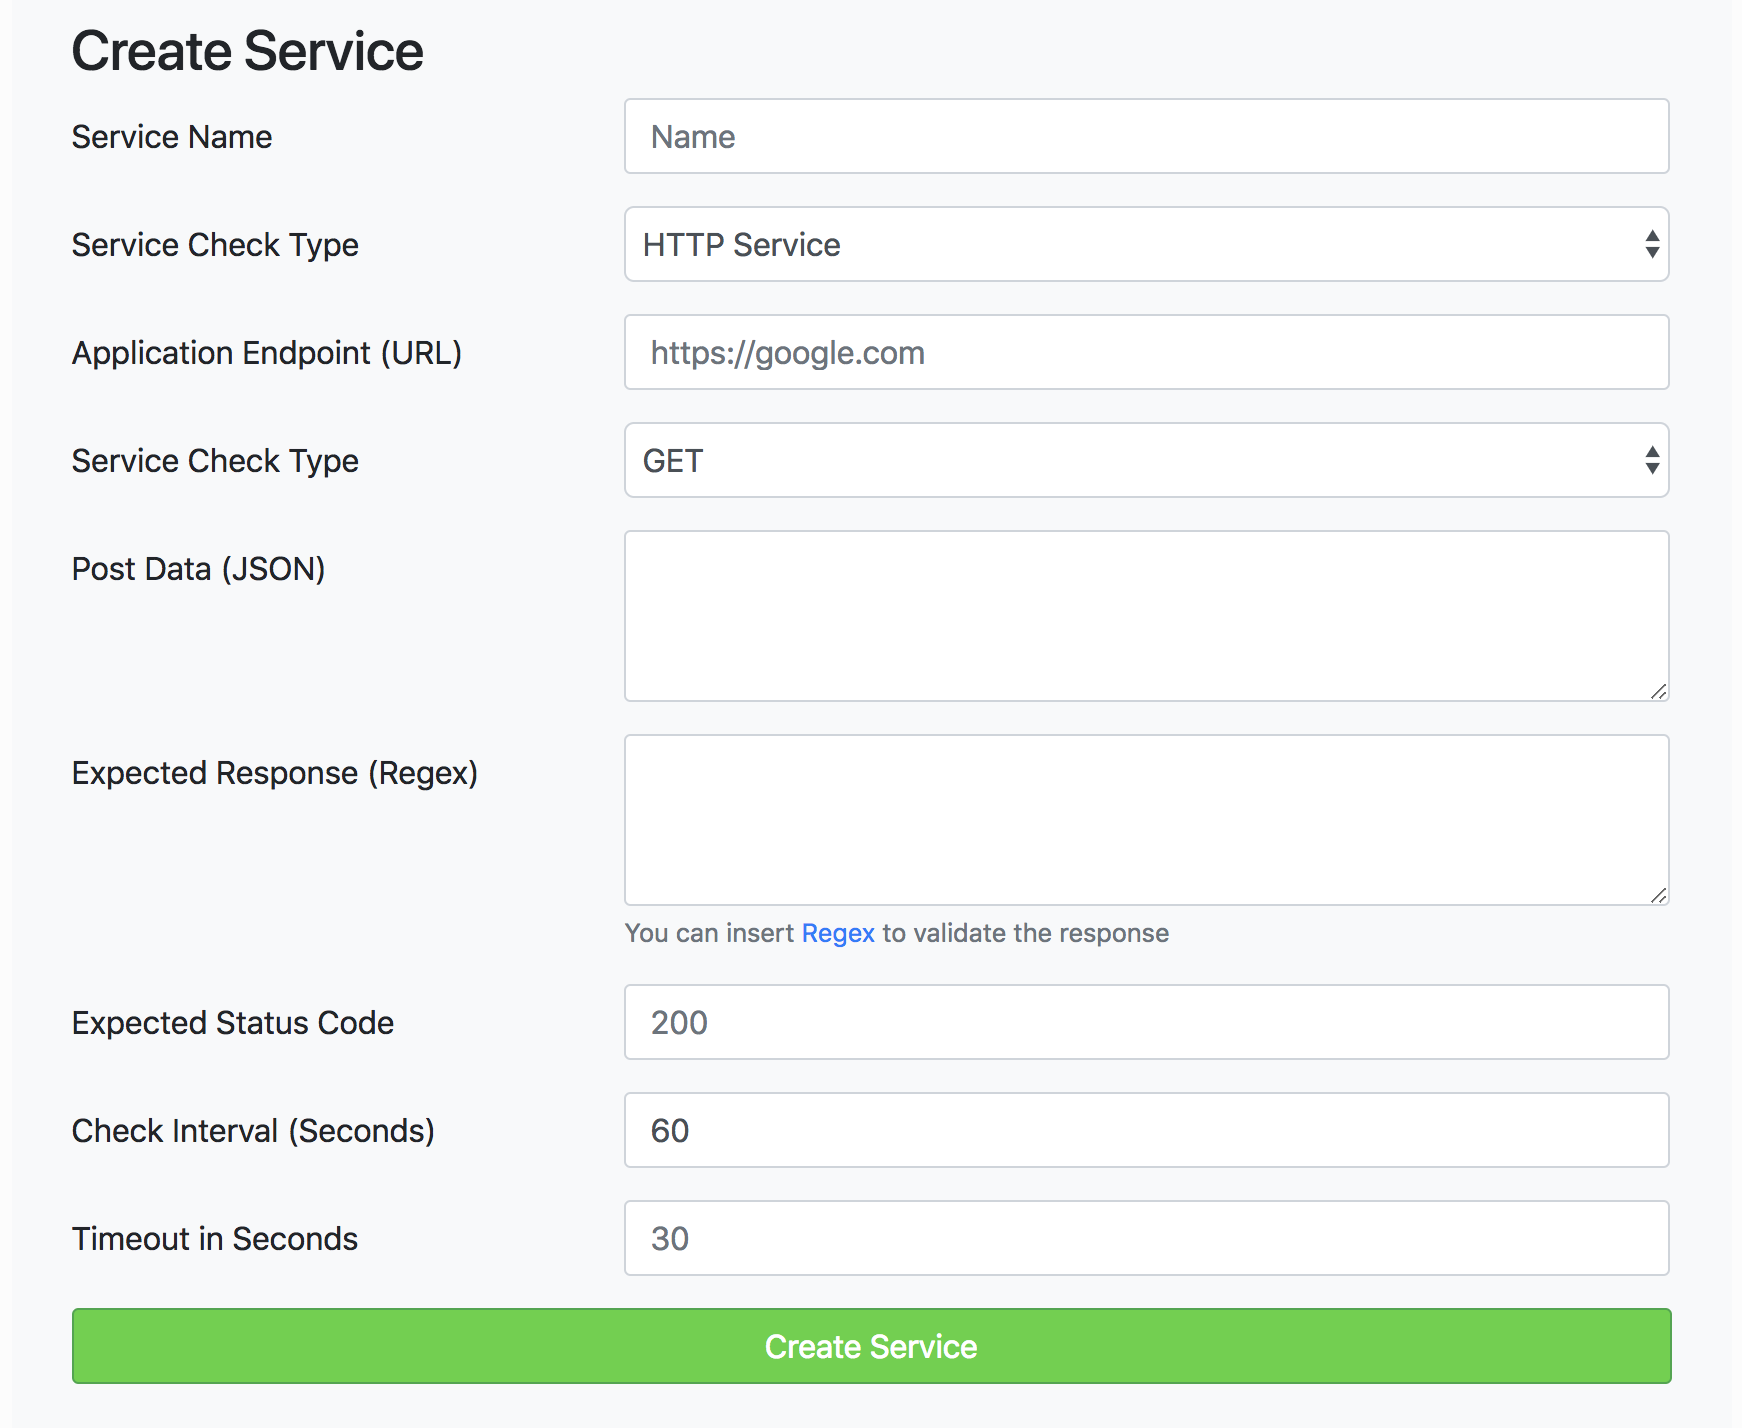
With a HTTP service, you can POST a JSON string to your endpoint to retrieve any type of response back. You can then use Regex in the Expected Response field to parse a custom response that exactly matches your status requirements.
For other services that don't use HTTP, you can monitor any type of service by using the PORT of the service. If you're Ethereum Blockchain server is running on 8545, you can use TCP to monitor your server. With a TCP service, you can monitor your Docker containers, or remove service running on a custom port. You don't need to include http in the endpoint field, just IP or Hostname.

You can send a ICMP (ping) to an endpoint rather than HTTP/TCP/UDP request for a quick response. For this service is fully work, you may need to run Statping as a sudo user.
Email: info@statping.com

statup-app