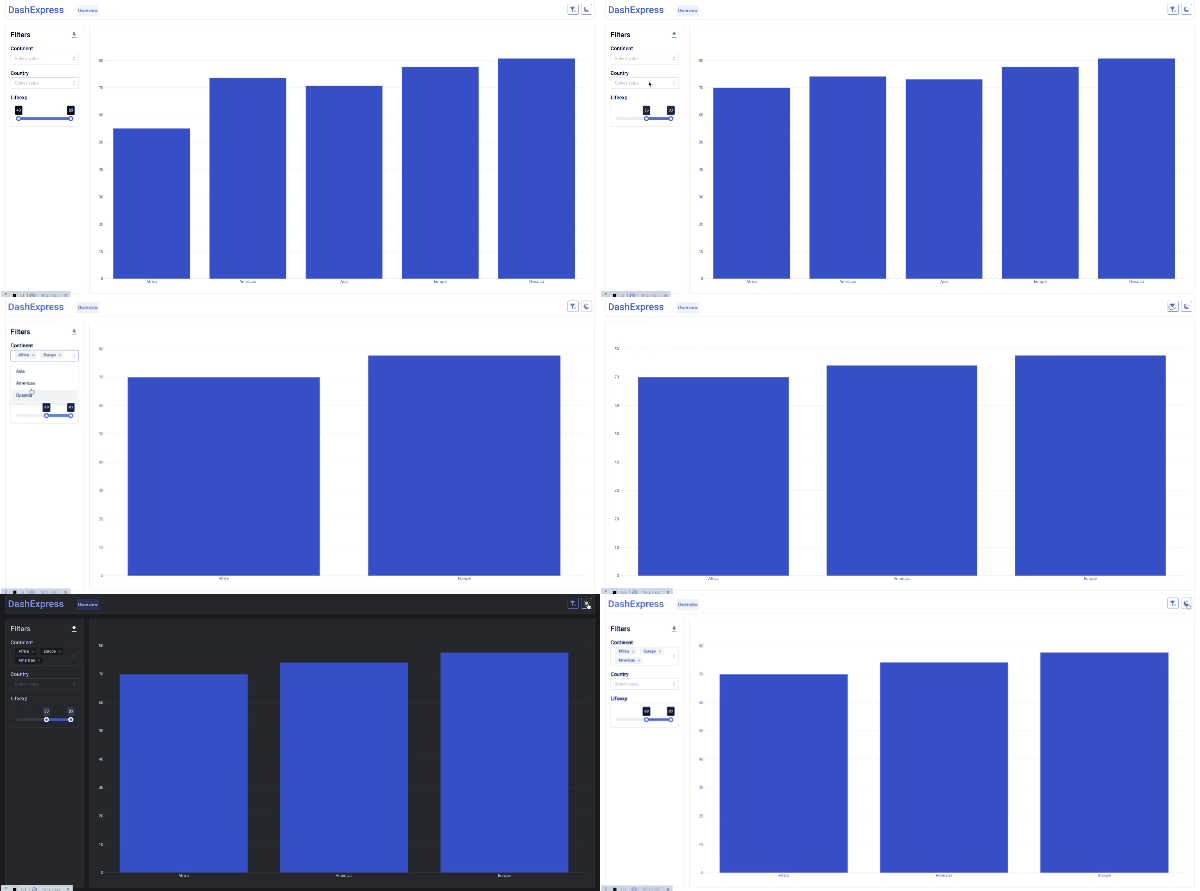
Build your next dashboard even faster with premade responsive UI and automatic callback-function. DashExpress is a wrapper over the Plotly Dash web framework, which allows you to simplify and speed up the creation of multi-page analytical applications based on data from pd.DataFrame.
pip install dash-expressCurrently supported: Charts, KPI, Geographical Maps
The key features are:
- High Performance: Provided by built-in optimization methods of Dash callback functions.
- Fast to code: Using a pre-configured UI and automatically generated callback functions.
- Based on Pandas: A library familiar to all analysts.
- Used Mantine UI: Pretty UI by Mantine React Library.
- Include Dark Theme: Use a dark theme for all components (including graphs and maps) without any additional actions.
The first step is to import the necessary libraries
import pandas as pd
import plotly.graph_objects as go
import dash_mantine_components as dmc

from dash_express import DashExpress, Page
Next, you need to initialize an instance of the Dash Express application.
app = DashExpress(
    logo='DashExpress',          # navbar logo, string or dict: {'dark':'path/to/darklogo.svg', 'light':...}
    cache=True,                  # flask_caching.Cache instance, dict or True (default: True)
    default_cache_timeout=3600,  # flask_caching.Cache timeout in seconds (default: 3600)
    app_shell=...,               # Appshell class for customization UI your app (default: BaseAppShell())
    # And standart Plotly Dash param
 )
The Dash Express object implements a Dash application with a pre-configured interface and automatic callback generation for quickly creating interactive multi-page web analytics applications.
Each application page is a separate object, an instance of the dash_express' class.Page. The page contains the source data for analysis, graph creation functions and a list of filters.
page = Page(
    app=app,                    # DashExpress app
    url_path='/',               # page url
    name='Owerview',            # page name in navigation buttons
    get_df=get_df,              # function for getting pd.DataFrame
    title='Owerview',           # page title
)The 'get_df` function contains the logic of getting data:
get_df = lambda: pd.read_csv('https://raw.githubusercontent.com/plotly/datasets/master/gapminder2007.csv')Next, you need to determine the layout of the dashboard. we recommend using dmc.Grid and dmc.SimpleGrid
page.layout = dmc.SimpleGrid(
    page.add_graph(h='100%',render_func=bar_func)
    )
The render_func parameter of the page.add_graph method is a graph generation function based on data from a DataFrame
# The logic of drawing a graph
def bar_func(df):
    pv = pd.pivot_table(df, index='continent', values='lifeExp').reset_index()
    fig = go.Figure([go.Bar(x=pv['continent'], y=pv['lifeExp'])])
    return fig
The last action is to add filters, which is done by simply calling the page.add_filter method and specifying the filtering column.
page.add_autofilter('continent', multi=True)
page.add_autofilter('country', multi=True)
page.add_autofilter('lifeExp', multi=True)These actions are enough to create a fully functional dashboard, so you can run the application.
app.run()import pandas as pd
import plotly.graph_objects as go
import dash_mantine_components as dmc
from dash_express import DashExpress, Page
# Incorporate data
get_df = lambda: pd.read_csv('https://raw.githubusercontent.com/plotly/datasets/master/gapminder2007.csv')
# Initialize the app
app = DashExpress(logo='DashExpress')
# Initialize the Page
page = Page(
app=app, # DashExpress app
url_path='/', # page url
name='Owerview', # page name in navigation buttons
get_df=get_df, # function for getting pd.DataFrame
title='Owerview', # page title
)
# The logic of drawing a graph
def bar_func(df):
pv = pd.pivot_table(df, index='continent', values='lifeExp').reset_index()
fig = go.Figure([go.Bar(x=pv['continent'], y=pv['lifeExp'])])
return fig
# Dashboard layout
page.layout = dmc.SimpleGrid(
page.add_graph(h='calc(100vh - 138px)',render_func=bar_func)
)
# By which columns to filter
page.add_autofilter('continent', multi=True)
page.add_autofilter('country', multi=True)
page.add_autofilter('lifeExp', multi=True)
app.run(debug=True)Python 3.7+
DashExpress stands on the shoulders of giants:
- Plotly Dash for the web parts.
- Pandas DataFrame for the data store & compute measure.
- Dash Mantine Components for the create pretty UI
- Dash Leaflet for the create maps
This project is licensed under the terms of the MIT license.
