Analysing Wordle Game Strategies using Information Theory concepts and optimising predictions to reduce Average number of guesses.
Carlos Rojas
Spring 2022
9
- Abhishek Reddy (https://github.com/abhishekri)
- Ayush Gupta (https://github.com/aygupta9800)
- Suhas Anand Balagar (https://github.com/suhasAB)
- Milan Mohan Joshi (https://github.com/Milan-Joshi)
Click to see more details from previous deliverable
What data you’ll use and where you’ll get it?- Scraping for all possible words on Sources tab of website (https://www.nytimes.com/games/wordle/index.html)
- Dataset involves upto 13,000 Valid English words with 5 letters each.
- Curated list of 2315 words published by Game Developer's partner.
Wordle is an online word guessing game,originally created by Software Engineer Josh Wardle and currently published by The New York Times Company since 2022.wherein a new 5 letter word is set by the game each day and it is supposed to be guessed by players within 6 tries. User gets feedback about the closeness of his/her guess by 3 color indicators. Green on a block suggests the letter exists in the target word and is in the exact position the player has guessed, Yellow indicates the letter exists in the target word, but not in the position the player has guessed. Grey indicates the letter doesn't exist in the target word. Using these clues,Players are supposed to make better guesses in the remaining guesses to get to the target word in the minimum number of guesses. We plan on analysing the game by exploring the trends and patterns in the 5 letter dataset,using Information theory concepts such as Entropy to deduce information gained from each guess and the best possible strategies to guess given the entropy calculated from the previous guesses. The goal is to come up with guesses having maximum entropy, i.e providing the most information so that we can use that information to make better guesses.This reduces the number of possible words in each turn. We also plan on exploring strategy of combining Entropy with Probability of Relative word Frequency of the possible words for guesses at each stage. The model should be able to come up with minimal and Informative guesses before reaching the target word.
The game can be played in both interactive mode and automated mode,but Only Automated Games are considered for Evaluating Output Metrics
Click to see more details
Regular expressions are particularly useful for defining filters. It will help us in reducing the possible words list. For the initial guess we will be generating the pattern using most frequent letters and then later on according to the information we get from the color of the letter we generate new regex pattern. We keep on doing this until we find our word.Click to see more details
Entropy can be a good parameter to choose guess word as it splits our dictionary of possible words in a more consistent manner and thus reducing next possible set of words. For every possible word W, there are 3 ^ 5(5 letter in wordle and three for gray, yellow and green) possible patterns after guessing that word. Each pattern p will result in a reduction of the possible candidate solutions to Sp, and the probability of obtaining this pattern is Sp / S where S is the original possible candidate solutions. So we calculate the entropy for a specific possible guess using:

If we guess the word which has maximum entropy, it leads to reduction in number of possible words after each guess.
Click to see more details
- Why - Based on the probability distribution of relative frequencies of words and letters we can estimate the best word possible for a given pattern after each guess.1.4. Entropy combined with Relative Frequency (To Optimize number of guesses considering Probability of Relative Frequency and Entropy)
Click to see more details
- Entropy Based Approach focuses on reducing possible words, based on Information gained after each guess.- Relative Frequency Approach focuses on choosing the best word for the given pattern at each guess based on relative frequency of letters and words involved.
- By combining these two approaches,we arrive at a tradeoff between selecting the best possible word closest to the answer and selecting the word which gives you the most amount of Information and thereby reducing the number of possible words after each guess.
Different Analysis of data is being done to understand the patterns and Frequency distribution of Letters and Words,so that it the insights from these analytics would help in forming the Game solver methods based on Information theory concepts.
In this method, primary aim is to get a list of all possible wordle answers i.e. 5 letter English words along with other curated and Most frequent subsets. We used web scraping on the wordle website’s source JavaScript code to extract the list of all possible answers(5 letter words). There were around 12972 words in the list, and it is saved in multiple formats (json, text, csv )for further processing. We also found a curated list of 2315 words which were hand selected the game founder’s wife. We found a dataset from Google books which maps the most common words in English language to it’s Frequency in Google books and other Online platforms. We filtered this dataset with just 5 letter words and arranged them in decreasing order of Frequency of words. We also normalized the frequency by dividing all frequencies with the maximum frequency to calculate and saved them in a new column called relative frequency.
We tried to analyse the frequency of each letter at position from 1 to 5 in 5 letter all-words list and curated word list given by wordle creators. As one of our approaches is based on the relative frequency of a word and we thought we can come up with a good guess first word whose letter has more frequency at the respected position. We calculated the total count at each position of letter and then calculated normalized frequency which would be from 0 to 1. Then we plot heatmap between alphabets and the position with color codes showing the frequency of letter.
Through this heatmap we can understand, that in curated word list, at pos 1, s has the most no. of words. similarly at pos 5, e and y has most words. so trying a word starting with s and ending with e or y can be a good first guess to remove the possible words after the first guess. Thus improving our chance to get maximum entropy gain. This visualization is done on curated words list of 2315 words as opposed to total 12,972 possible guesses in Wordle. We chose to focus only on the possible winning answers for the analysis because our goal is to find the best guesses for human player. While some might think, we are biasing toward only those words that can win, we have counter argument that all possible correct answer words are known beforehand, so using them is valid and good strategy toward reaching final answer.
Broadly considering I plotted two visualizations. First is calculating the frequency of individual character, second is frequencies of characters in every slot of Wordle game. We considered three datasets to do this.
Datasets
-
Valid Guesses This is a list of 13,000 words from the source code dataset.
-
World Curated It is a curated list of words around 2,000 words that appear to be most frequent suggested by cofounder’s spouse.
-
Valid Solutions Contains a list of all words that have appeared each day as a solution.
2.3.1 Calculating Individual Character Frequency
I tried to analyze the frequency of different characters from all alphabets from A to Z.
a) Viable Wordle Guess Plotting the frequency of each character from the source dataset.
b) Viable Wordle Solutions Analyzing each character frequency from the curated dataset list.
c) Previous Wordle Solutions Similarly calculating the frequency of individual character based on previous wordle solutions.
2.3.2 Calculating Frequency of Characters in all the Five Slots
This is calculating the frequency of each character in different slots and also the combines frequency from the five slots. Similar to the calculations we did in the step 1), we are doing it for 3 datasets.
The whole idea is to optimize or reduce the number of tries or steps in playing game may be 3 or even less than that. To understand which dataset or even combined datasets to use, or on what frequency we should try to solve using entropy; we need to understand efficient possible ways of data sourcing. Combining frequencies from different datasets of each character will help us to assign a priority or weightage to individual alphabet.
In this method, the aim was to find the most frequent five letter words which are used in the books and are also present in wordle words. So, I got the data for the frequency of google books common words. As this data contains word lengths of other than five, I put a check to add only five letter words to the list. I mapped the words in the wordle list and curated words list to the list of five-letter words with frequency. Then I plotted the horizontal bar graph with curated words on the y-axis over frequency on the x-axis.
The above bar graph shows the top 20 most frequently used words. We are anticipating that using the word for our first guess based on the relative frequency of the word with entropy combined is a good strategy to reduce the number of possible words for the next guess.
Why this approach: Regular expressions are particularly useful for defining filters. It will help us in reducing the possible words list.
I started by importing the valid solutions word list of 2315.
Then I found the letter frequency which will be used to form the regex pattern for the initial guess. The idea here is to get maximum information from the initial guesses.
Then we wrote a function isUniqueChars that accepts a word as parameter and returns true if all the five letters of the word are unique. We are doing this because we want to select a word which has unique characters so that we can gain maximum information by filtering out maximum letters.
We wrote a function regex_wordle which accepts the input word i.e the word to be guessed. For the initial guess, we will form a pattern that will contain the most frequent letters. Initial pattern =r's[earot]{4}'. As we can see from the graph in point 2 above letters e, a,r,o, and t have the most frequencies and from the Heatmap we can see that the letter s is the most common letter in the first position. That’s why we are forming an initial pattern using these letters so that we can gain maximum information. Using this pattern, we are filtering out words that contain these letters from our data of 2315 words. Then, using the isUniqueChars function we form a list of words that have unique characters and select the first word from the list so that we can select a word that can filter out maximum letters. Now, we compare the selected word with the input word and form an array of 0s, 1s, and 2s. I have represented the grey letter as 0, yellow letter as 1, and green letter as 2. After comparing if we get the array as [0,0,0,0,0] i.e all grey letters then we select the next 5 most frequent letters as our pattern from the graph shown in point 2. Else, we form a new regex pattern using the AND logic. E.g., if the input word is ‘crave’ then the selected word is ‘stare’ and the result array generated is [0, 0, 2, 1, 2] as the letters at position 1 and 2 are grey i.e 0 so they should be negated from the whole word, letters at position 3 and 5 are green i.e 2 so they should be kept as it is and letter at position 4 is yellow i.e 1 they should be negated only from this position. So the pattern generated will be [^st][^st][a][^rst][e].
[^st] - first letter is not S or T [^st] - second letter is not S or T [a] - third letter is definitely A [^rst] - fourth letter is not T, S, or R [e] - fifth letter is definitely E
Then from the filtered words we select only those words which contain the letters that were marked yellow i.e 1. We will keep on repeating the above steps until we find a perfect match.
To do statistical analysis on our regex approach, we tested our algorithm for 1000 words from our data. Based on that, we calculate the guess count for each of the 1000 trial sequence. So, for 1000 words we got perfect match for 879 words and the total attempts taken was 3596.
Based on the probability distribution of relative frequencies of words and letters we can estimate the best word possible for a given pattern after each guess.
We will start the program with a function called compare words where we compare our guessed word with the solution, which we already have beforehand. We chose to represent the results as strings, with a 0 representing a letter that is not present, a 1 representing a letter present but in the wrong spot and a 2 a letter present and in the right spot.
Once as we have this pattern, we created a function that filters the words to keep only the ones that match the pattern, giving us the list of words that are still possible solutions.

As we have multiple words to choose from, it would be nice if we could assign a score to each of them, telling us how beneficial playing the word will be. A first idea for a scoring function is, a word which contains common letters will be better to play, because it’s more likely it will match letters from the solution. Hence we took a list of letters ranked by frequency of use in English words. We constrcuted a score function based on that.
As we have the score function, we can rank all our possibilities sorted by score and choose the best one. We have to repeat the same approach with pattern matching, and then assigning score and checking the word. We might have been a little lucky or unfortunate with this approach, depending on the number of steps we took to solve it. Now we can test our solver over all the possible solution words, to see how we do on average.
We defined functions to determine the robustness of our approach, and we found the following. With this approach, we can find the word in about 3.8 tries on average, which is relatively better. However, there are on average 29 or 30 words out of 2315 words that takes more than 6 tries, so the failure rate is around 1.38 and the success rate is 98.62. Following are the functions to test solution and evaluate solver.
The entropy is a good parameter to choose guess word as it splits our dictionary of possible words in a more consistent manner.
For every possible word W, there are 3 ^ 5(5 letter in wordle and three for gray, yellow and green) possible patterns after guessing that word.
Each pattern p will result in a reduction of the possible candidate solutions to Sp, and the probability of obtaining this pattern is Sp / S where S is the original possible candidate solutions.
So we calculate the entropy for a specific possible guess using:
We can then guess word which has maximum entropy.
First, we load our all valid guesses word list and curated word list into the notebook. In this approach we try to reduce the possible curated words after each guess to come up with answer in minimum guess.
Then, We create a function to convert a guess word into a tuple of 5 length with 0 representing grey, 1 representing yellow and 2 for green in a pattern.

We then create wordPatternMap for each word in curated word list. each word will have 243 patterns and next possible set of words for that pattern. We load this wordPatternMap into a .p file as cache as this map will be of large size and take some time to process. So we can avoid same processing next time we run the project.

Then we use the entropy calculation for each possible word before the next guess and choose maximum entopy word as next guess.

Then we try to simulate solving NYTimes wordle problem interactively by feeding best entropy word as guess word in wordle and putting feedback of grey, yellow and green letter in form of 0,1,2 in our notebook.

Next, we run to calculate guess count result using 1000 trial sequence by randomly choosing one word out of 2315 curated word as real answer for that trial.

We draw pie chart and horizontal bar graph to visualize the guess count distribution for 1000 trials.
Average Guess Count = 3.7
Failure Rate(Guess count more than 6) = 1.1 %
Success Rate = 98.1 %
Entropy Based Approach focuses on reducing possible words, based on Information gained after each guess. Relative Frequency Approach focuses on choosing the best word for the given pattern at each guess based on relative frequency of letters and words involved. By combining these two approaches,we arrive at a tradeoff between selecting the best possible word closest to the answer and selecting the word which gives you the most amount of Information and thereby reducing the number of possible words after each guess.
We created a method to compare a given word with a target word and return a numerical string of length 5.Each character could be 0,1,2 depending upon following conditions. 0 if the letter doesn’t exist in the target word, return 1 of the letter exists in a different position and 2 if the letter is exactly present in the same position.
We created another method to filter the possible outcomes for a given guess and the pattern it generates with respect to the target word.
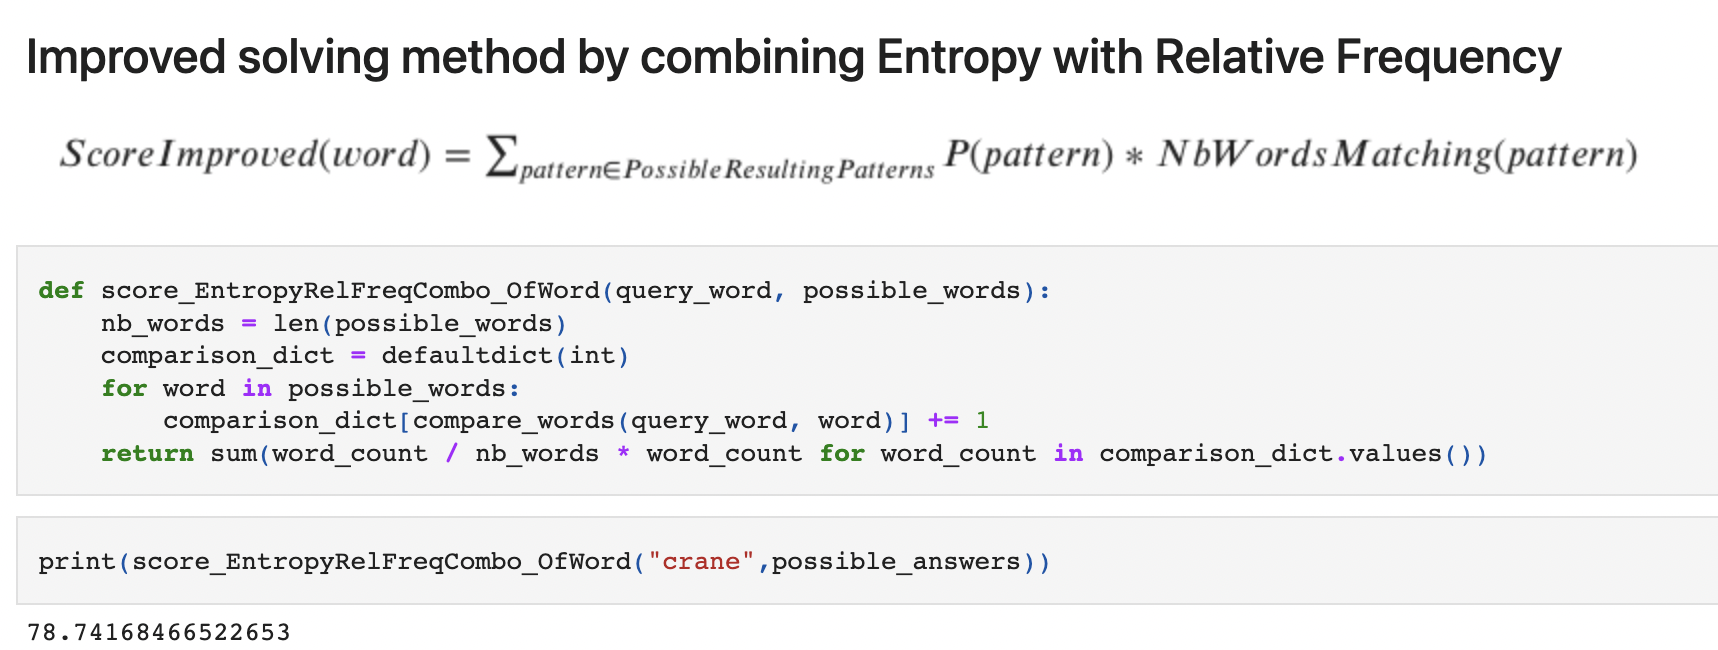
To optimize the process of guessing words, we take into account all the possibilities after playing a candidate word. We can compute, for every possible resulting pattern, the number of words that will match it. The best candidate will be the word which leaves the fewest possibilities when averaged over all the possible results.To rank the possible remaining words,we can use a scoring mechanism that considers things like Relative Frequency,Pattern Matching and Information gain after each guess.
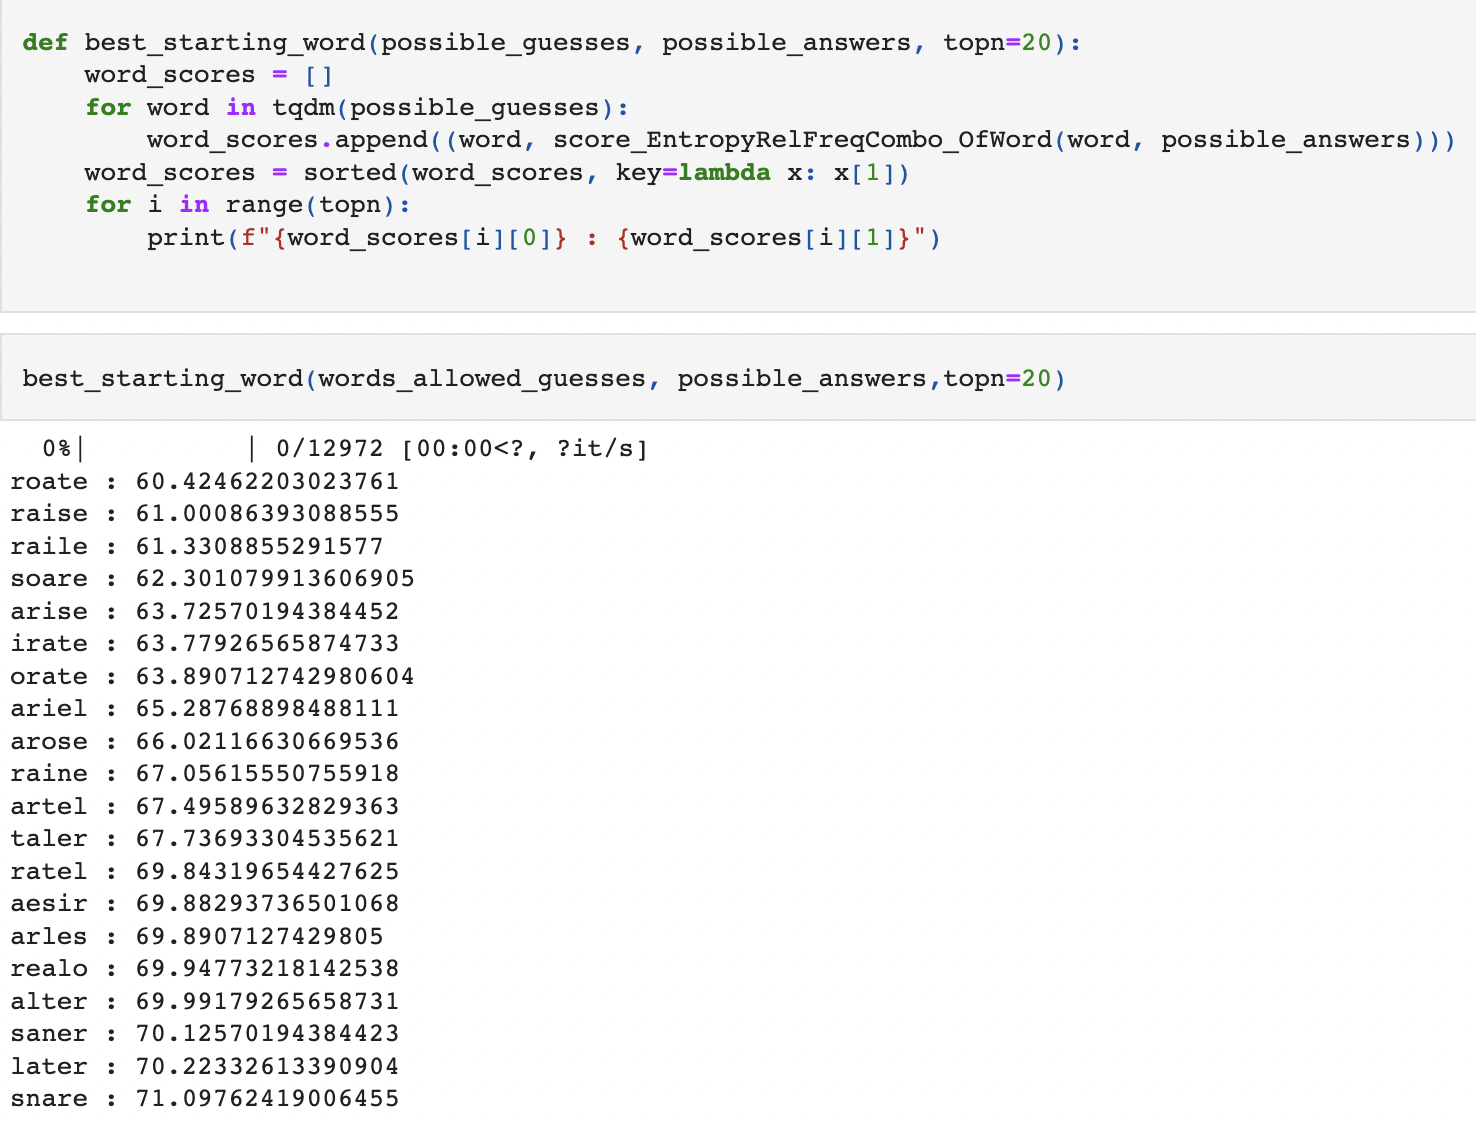
This score can be used to rank the best possible candidates among remaining possible words,as well as best starting words. We came up with 2 methods to solve wordle with the help of the new scoring mechanism.
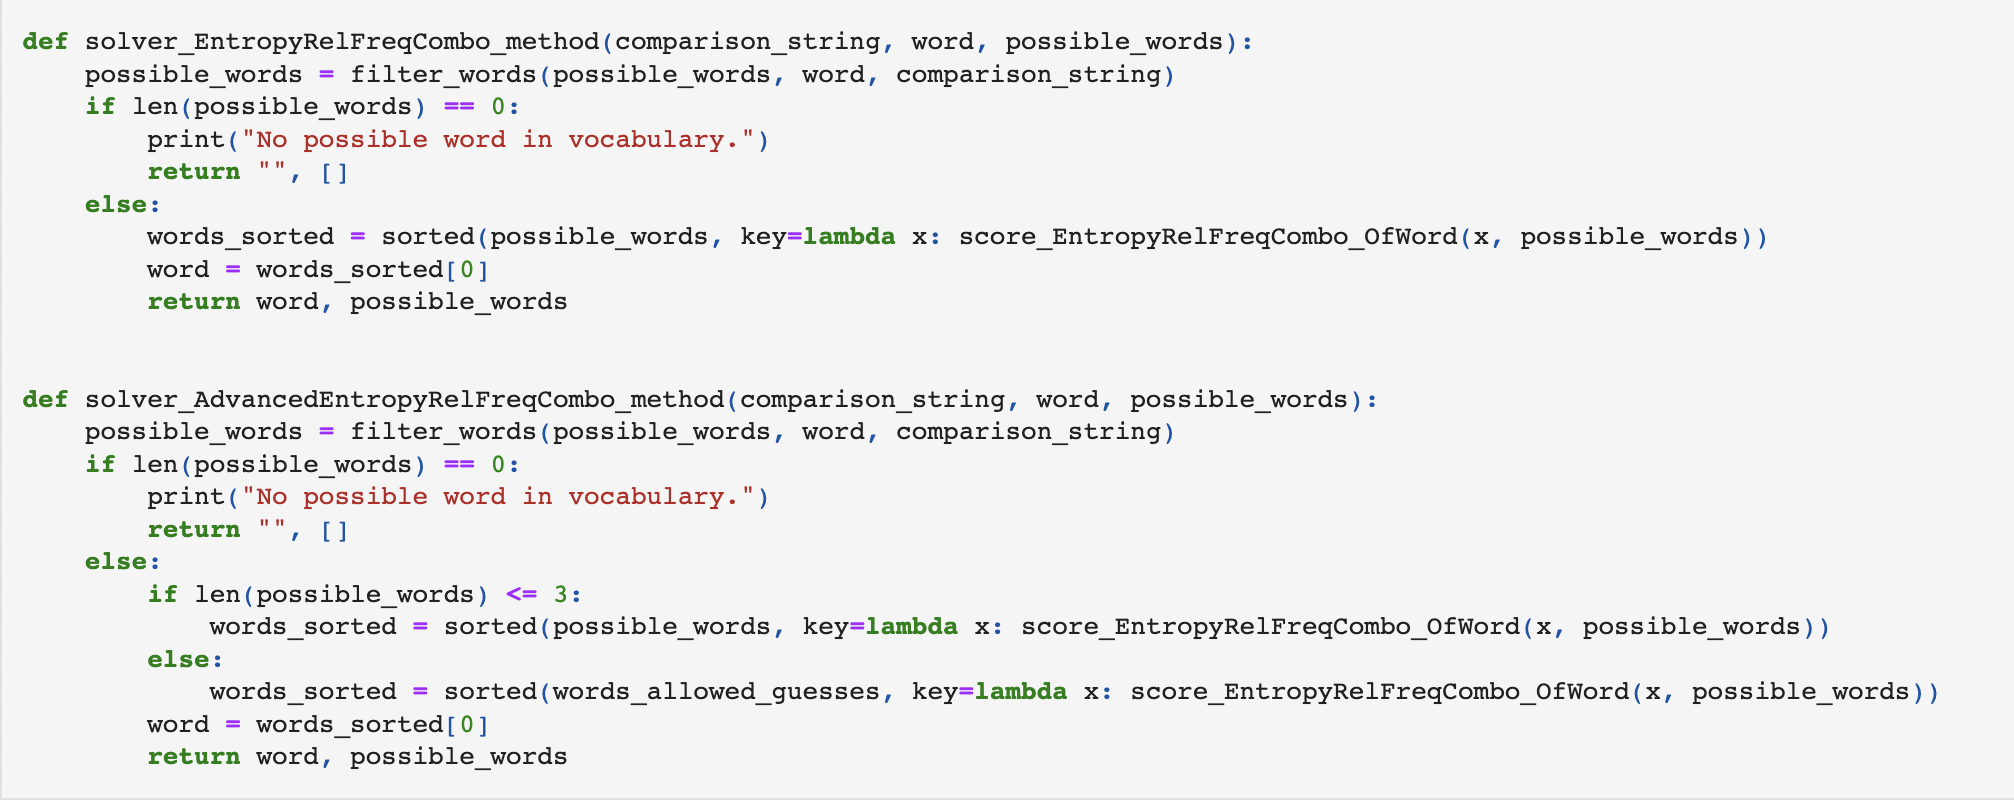
- The 1st method is similar to Relative Frequency based solver,just the scoring mechanism is replaced with the new one. This method tries to guess answers that can match the target word the most,based on the ranking of remaining words using the new scoring mechanism.
- The 2nd Method tries to optimize the problem even further by eliminating the limitation of only using words that could be a solution. Here,if the number of words possible is more than 3,this method tries to use words that cannot be the solution, but which would give us more information. If the number of words is less than or equal to 3,it goes back to guessing the words based on rankings of possible word solutions. This uses a tradeoff between pattern matching of Relative Frequency and Information gain of Entropy approach to find the optimal solution.
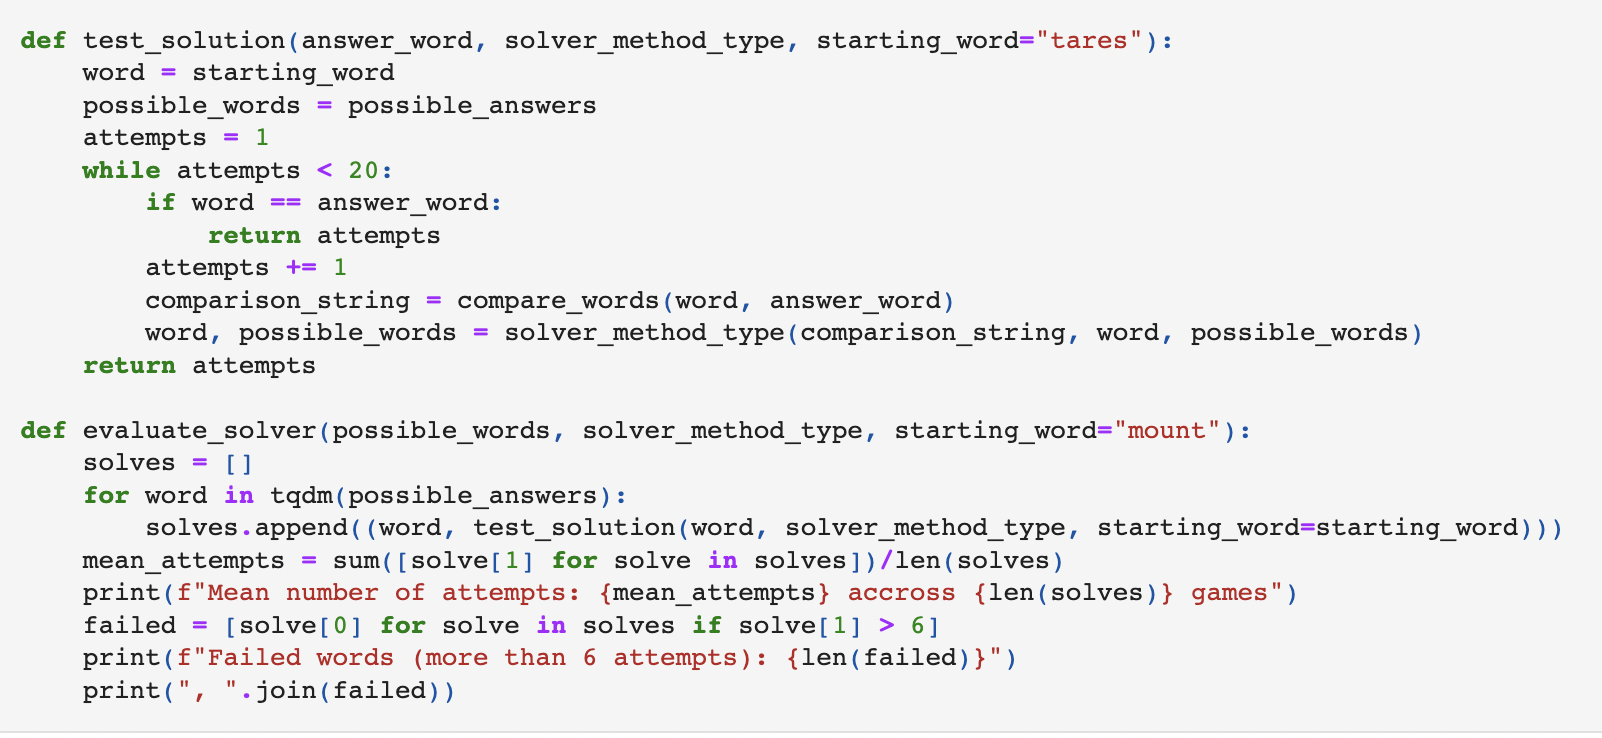
- To test out single solutions that return the number of guesses for a given method.
- To test multiple solutions and returns the mean number of guesses and number of failed games for a given method.
- Base solver_EntropyRelFreqCombo_method has an average number of attempts of around 3.6 and an average success rate of 99.3%.
- Optimized solver_AdvancedEntropyRelFreqCombo_method has an average number of attempts of around 3.5 and an average success rate of 100%
-
Regex Approach uses pattern matching to come up with guesses.
-
Relative Frequency Approach employs choosing the best word possible for a given pattern after each guess.
-
Entropy Based Approach tries to reduce the number of possible words after each guess.
-
Combination of Entropy with Relative Frequency employs both Information gain and best word selection based on number of possible words remaining.
Our finding:
Therefore, we can conclude that we can optimally solve the wordle problem by combining entropy with relative frequency for best results in comparison to other methods we have used.


