The Single Cell Network Synthesis tool (SCNS) is a tool for the reconstruction and analysis of executable models from single-cell gene expression data, which supports easy deployment of computation to the cloud for performance and control via a web-based graphical interface. SCNS can be used for understanding differentiation, developmental, or reprogramming journeys.
SCNS takes single-cell qRNA or RNA-sequencing data, and treats expression profiles as binary states, where a value of 1 indicates a gene is expressed and 0 indicates that it is not. It then constructs a state transition graph, where pairs of states are connected by an edge if they differ in the expression of exactly one gene. This data is used as the basis to reconstruct Boolean logical regulatory rules, by searching for rules that drive transitions from early cell states towards late cell states. Because the resulting models are executable, they can be used to make predictions about the effect of specific gene perturbations on the generation of specific lineages, to suggest strategies for improving reprogramming efficiency, or to introduce cancer-associated mutations and pinpoint interventions that revert the model to a wild-type state.
For data sets of up to a few thousand cells, SCNS can typically reconstruct a Boolean network model on your desktop machine within minutes. For larger data sets, configuring SCNS to deploy computation to your Azure cloud account may be desirable.
Software requirements:
- Microsoft Windows, macOS or Linux.
- A modern browser such as Edge, Chrome or Firefox as your default browser.
- The .NET framework or mono.
- The R programming language, and the R binaries in your PATH. There is a known issue with R.NET that currently means R version 3.5.0 is not compatible with SCNS.
Hardware requirements:
- 1 GHz or faster 64 bit processor.
- 1 GB of RAM.
- 2GB hard drive with at least 1GB of free space.
To install SCNS, download the latest zipped binaries from here: https://github.com/swoodhouse/SCNS-GUI/releases. SCNS_GUI.exe will start the SCNS toolkit.
To run on Linux or macOS under mono:
mono SCNS_GUI.exe
As an initial illustration of the tool, we will reconstruct the Boolean network model from the paper, Hierarchical Differentiation of Myeloid Progenitors Is Encoded in the Transcription Factor Network (Krumsiek, Marr, Schroeder, & Theis, 2011). State space data was generated from this model by running it from an initial state. We will now reconstruct the model from this state space data using SCNS. After starting SCNS, your web browser will open and you will be presented with the ‘Load Data’ page.
-
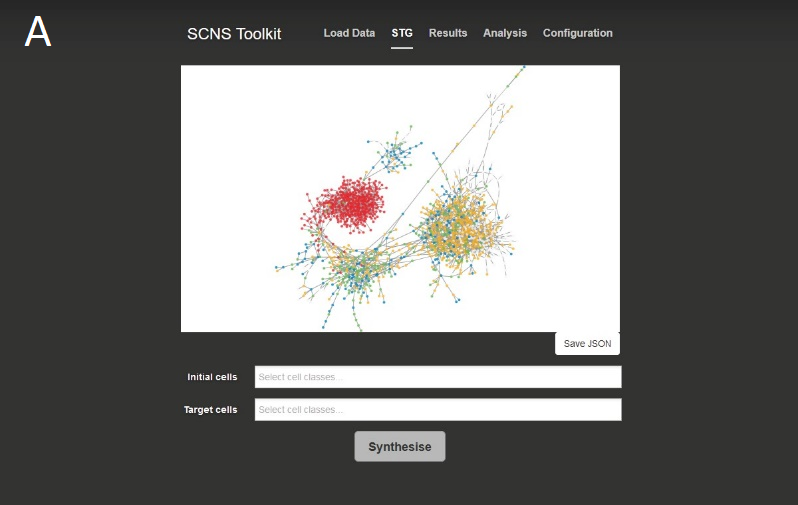
Click ‘Upload CSV’ and select cmp.csv. You will now be presented with the ‘State transition graph’ page, which displays a graph representation of the state space data and allows configuration of parameters.
-
Using the ‘Initial cells’ text box, select ‘initial’. Using the ‘Target cells’ text box, select ‘nonInitial’.
-
Then, using the controls at the bottom of the page, select the following parameters: Cebpa = (1, 2, 100), EKLF = (1, 1, 100), EgrNab = (2, 1, 100), Fli1 = (1, 1, 100), Fog1 = (1, 0, 100), Gata1 = (2, 1, 100), Gata2 = (1, 2, 100), Gfi1 = (1, 1, 100), Pu.1 = (1, 1, 100), Scl = (1, 1, 100), cJun = (1, 0, 100).
-
Finally, click ‘Synthesise’.
-
You will be taken the ‘Results’ page, and after a few moments the synthesised Boolean functions for each gene should be displayed in a table. Use the tabs at the top of this table to switch between the results for different genes.
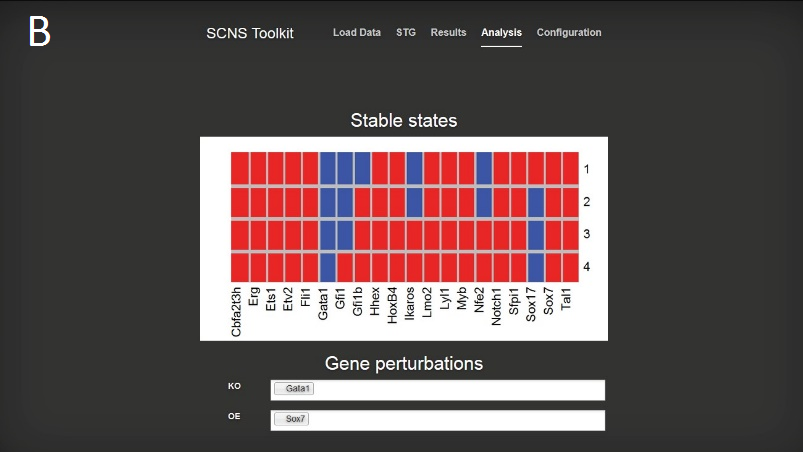
-
Switch to the ‘Analysis’ page by using the link at the top of the page to examine the stable states of the model and to experiment with knock out and over expression perturbations.
We will now run SCNS on a recently published single-cell RNA-seq data set consisting of 1529 cells from 88 human embryos, from day 3 to day 7 of preimplantation development (Single-Cell RNA-Seq Reveals Lineage and X Chromosome Dynamics in Human Preimplantation Embryos, Petropoulos et al., 2016). We will few the discretised single-cell gene expression data as though it were state space data from a Boolean network, and then use SCNS to reconstruct the underlying model.
-
Return to the ‘Load Data’ page, by using the link at the top of the page.
-
Click ‘Upload CSV’ and select preimpl.csv.
-
Using the ‘Initial cells’ text box, select ‘E3’. Using the ‘Target cells’ text box, select ‘E7_target’.
-
Then, using the controls at the bottom of the page, select the following parameters: ARGFX = (2, 0, 70), CDX2 = (3, 0, 70), DLX5 = (1, 0, 80), GATA2 = (1, 0, 90), GATA3 = (1, 0, 90), GATA4 = (1, 0, 80), GATA6 = (1, 0, 80), GCM1 = (2, 0, 70), HAND1 = (1, 2, 70), HNF1B = (1, 0, 80), HNF4A = (1, 2, 60), KLF17 = (1, 1, 80), LBH = (1, 0, 70), NANOG = (1, 0, 70), OVOL1 = (1, 0, 100), POU5F1 = (2, 0, 80), PRDM14 = (1, 1, 60), PRDM16 = (1, 0, 10), SOX17 = (2, 0, 70), SOX2 = (3, 0, 80).
-
Click ‘Synthesise’.
To run on your Azure account, go to https://manage.windowsazure.com/publishsettings and download your publishsettings file. Save this as a file called azure.publishsettings and put in the SCNS installation folder. Then, after starting SCNS go to the config page and select “Run in cloud”. The first time you start up SCNS after saving your publishsettings file you will need to give the tool a few minutes to set up a cluster on your Azure account.