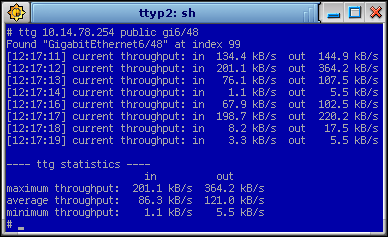
TTG is a small command line utility that displays current throughput (bandwidth usage) on an interface of a remote device such as router, switch, firewall, etc., over SNMP. You can think of TTG as command line version of STG or a high-interval/ad-hoc query/test tool for MRTG, etc. The output is very similar to ping(1) command. You can use it to quickly check/measure traffic before waiting 5 minute cycle when configuring MRTG, as a means of using the data in text form (eg. copy&paste in to an email or spreadsheet) or just a general purpose command line network administration aid.
TTG allows you to specify: SI prefix k/M/G (default is auto), units bits/bytes (b/B), size of "kilo" which can be either 1000 or 1024 depending on a personal opinion (default is 1000), interval in seconds and count limit. Finally the utility also allows you to list all interfaces of the device and can take interface name, such as "FastEthernet1/1" or it's abbreviation ("fa1/1") instead of OID name/number as the parameter.
snap install ttg
For other platforms go to releases tab
Q: I get zero values every second line of output or more often, or inaccurate readings, eg:
  [11:38:16] current throughput: in 40.8 Mb/s out 39.3 Mb/s
  [11:38:26] current throughput: in 0.0 Mb/s out 0.0 Mb/s
  [11:38:36] current throughput: in 40.9 Mb/s out 39.4 Mb/s
  [11:38:46] current throughput: in 0.0 Mb/s out 0.0 Mb/s
A: Increase the polling interval (option -i) till high enough. Some agents may require even 60 seconds or higher.
On Cisco IOS you can try this:
(config) # snmp-server cache interval 1
If your agent is Net-SNMP try this:
$ snmpset -c private -v 1 x.x.x.x 1.3.6.1.4.1.8072.1.5.3.1.2.1.3.6.1.2.1.2.2 i 1
Q: On Windows I get a lot of weird virtual interface names when using list?
A: Use listphy or lp argument instead. Extended mode -x required.
Q: Where does the OpenVMS Net-SNMP port come from?
A: Tanks to Siemens AG from here.
Q: Why doesn't TTG use ISO/IEC 80000 notation?
A: Because MiB stands for Men in Black also this
