This project is meant to be an advanced implementation of stacked neural networks to predict the return of stocks. My goal for the viewer is to understand the core principles that go behind the development of such a multilayer model and the nuances of training the individual components for optimal predictive ability. Once the core principles are understood, the various components of the model can be replaced with the state of the art models available at time of usage.
The workflow is similar to the approach in the excellent text Advances in Financial Machine Learning by Marcos Lopez de Prado, which I recommend to anyone who wants to learn about applying machine learning techniques to financial data. The data that was used for this project is not in the repository due to size constraints in GitHub, but the raw data was open sourced from Tick Data LLC, but now I believe is not available.
In essense, we will be making bars (tick, volume or dollar) based on the tick data, apply feature engineering, reduce the dimensions using an autoencoder and finally use a machine learing model to make predictions. I have implemented both a LSTM regression model and a Random Forest classification model to classify the direction of the move.
This model is not meant to be used to live trade without modifications. However, an extended version of this model can very well be profitable with the right strategies.
I truly hope you find this project informative and useful in developing your own trading strategies or machine learning models.
This project illustrates how to use machine learning to predict the future prices of stocks. In order to efficiently allocate the capital to those stocks, check out OptimalPortfolio
Disclaimer, this is purely an educational project. Any backtesting performance do not guarentee live trading results. Trade at your own risk. This is only a guide on the usage of the model. If you want to delve into the reasoning behind the model and the theory, please check out my blog: Engineer Quant
- Contents
- Overview
- Quickstart
- Bar Sampling
- Feature Engineering
- Stacked Autoencoder
- Neural Network Model
- Random Forest Model
- Results
- Online Learning
- What next?
- Contributing
Those who have done some form of machine learning would know that the workflow follows this format: acquire data, preprocess, train, test, monitor model. However, given the complexity of this task, the workflow has been modified to the following:
- Acquire the tick data - this is the primary data for our model.
- Preprocess the data - we need to sample the data using some method. Subsequently, we make the train-test splits.
- Train the stacked autoencoder - this will give us our feature extractor.
- Process the data - this will give us the features of our model, along with train, test datasets.
- Use the neural network/random forest to learn from the training data.
- Test the model with the testing set - this gives us a gauge of how good our model is.
Now let me elaborate the various parts of the pipeline.
For those who just want to see the model work, run the following code (make sure you are on Python 3 to prevent any bugs or errors):
pip install -r requirements.txt
python run.py
Note: Due to GitHub file size restrictions, I have only uploaded part of the data (1 million rows), so the model results may vary from the one shown below.
Running machine learning algorithms, or any other statistical models, directly on tick level data often leads to poor results, due to the high level of noise caused by the bid-ask bounce, and the high nonlinearity in the nature of the data. Therefore, we need to sample the data at some interval (which can be decided depending on the frequency of the predictive model). The sampling that we are used to seeing is time sampled (we get bars every 1min), but this is known to exhibit non stationarities and the returns are not normally distributed. So, as explained in Advances in Financial Machine Learning, we are going to sample it according to the number of ticks, or the amount of volume or the amount of dollars traded. These bars show better statistical properties and are preferable for machine learning applications.
Given our OHLCV data from our sampling procedure, we can go ahead and create features that we feel might add information to the forecast. I have constructed a set of features that are based on moving averages and rolling volatilities of the various prices and volumes. This set of features can be extended accordingly.
Given our features, we notice that the dimension of the dataset is huge (185 for my configuration). This can pose a lot of problems when we run machine learning algorithms due to the curse of dimensionality. However, we can attempt to overcome this by using neural networks that are able to decompress the data given into smaller number of neurons than the input number. When we train such a neural network, it becomes able to extract the 'important sections' of the data so to speak. Hence, this compressed version of the data can be considered as features. Although this method is useful, the downside is that we do not know what the various compressed data points mean and hence cannot extract methods to achieve them in differnt datasets.
Using neural networks for the prediction of time series has become widespread and the power of neural networks is well known. I have used a LSTM model for its memory property. However, an issue I faced with the training of the neural network model is that there was a tendency for the model to fit to a constant, as it turned out to be a local minima for the loss function. One way to overcome this is using different initialisations for the weights, and tuning the hyperparameters.
Sometimes, it might be better to use a simpler model as apposed to a sophisticated neural network. This is especially true when the amount of data available is not enough for deep models. Even though I used tick level data, the dataset was only around 5 million rows. After sampling, the number of rows drops and it is not enough for deep learning models to learn effectively from. So, I wanted to use a random forest classification model that classified the direction of the next bar.
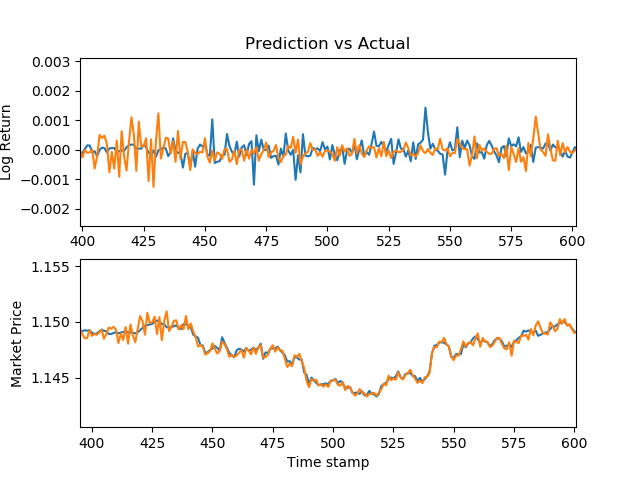
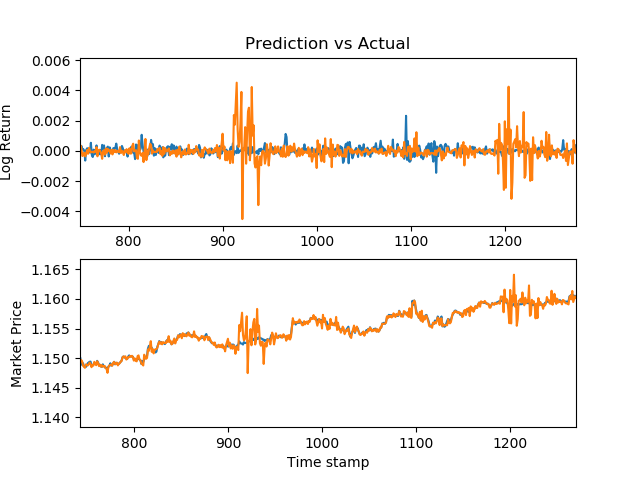
Using this stacked neural network model, I was able to achieve decent results. The following are graphs of my predictions vs the actual market prices for various securities.
EURUSD
EURUSD prices - R^2: 0.90
For the random forest classification model, the results were better. I used tick bars for this simulation.
The base case used is merely predicting no moves in the market. The out of sample results were:
Tick bars:
    Model log loss: 2.78
    Base log loss: 4.81

Volume bars:
    Model log loss: 1.69
    Base log loss: 5.06

Dollar bars:
    Model log loss: 2.56
    Base log loss: 2.94
It is also useful to understand how much of an impact the autoencoders made, so I ran the model without autoencoders and the results were:
Tick bars:
    Model log loss: 5.12
    Base log loss: 4.81

Volume bars:
    Model log loss: 3.25
    Base log loss: 5.06

Dollar bars:
    Model log loss: 3.62
Base log loss: 2.94The training normally stops after the model has trained on historic data and merely predicts future data. However, I believe that it might be a waste of data if the model does not also learn from the predictions. This is done by training the model on the new (prediction, actual) pairs to continually improve the model.
The beauty of this model is the once the construction is understood, the individual models can be swapped out for the best model there is. So over time the actual models used here will be different but the core framework will still be the same. I am also working on improving the current model with ideas from Advanced in Financial Machine Learning, such as adding sample weights, cross-validation and ensemble techniques.
I am always grateful for feedback and modifications that would help!
Hope you have enjoyed that! To see more content like this, please visit: Engineer Quant


