Skip to content
New issue

Have a question about this project? Sign up for a free GitHub account to open an issue and contact its maintainers and the community.

By clicking “Sign up for GitHub”, you agree to our terms of service and privacy statement. We’ll occasionally send you account related emails.

Already on GitHub? Sign in to your account

scale_color_gradient2 doesn't entirely respect limits argument #2230

Closed
rpruim opened this issue Aug 3, 2017 · 3 comments
Closed

scale_color_gradient2 doesn't entirely respect limits argument #2230

rpruim opened this issue Aug 3, 2017 · 3 comments
Labels
bug an unexpected problem or unintended behavior scales 🐍 wip work in progress

Comments

@rpruim
Copy link

rpruim commented Aug 3, 2017

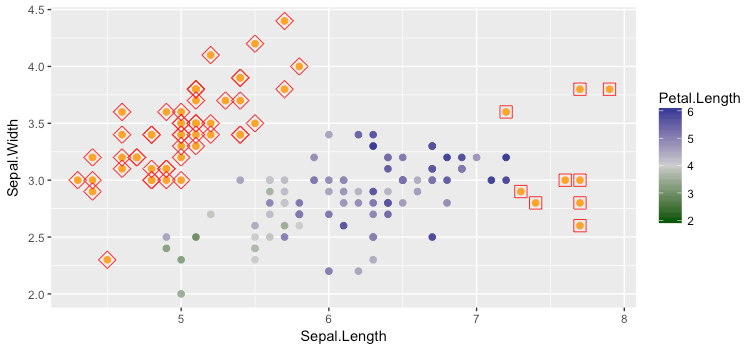
If midpoint is not half-way between the two values in limits, then the gradient scale extends beyond the limit that is closer to midpoint but the guide stops where limits specifies. Especially in conjunction with na.value, this can mislead the reader.

In this plot the color scale goes below what the guide displays, and values below 2 are not indicated as NA.

library(scales)
library(ggplot2)
library(dplyr)
ggplot(mapping = aes(x = Sepal.Length, y = Sepal.Width) ) +
  geom_point(data = iris, aes(color = Petal.Length), size = 2) +
  geom_point(data = iris %>% filter(Petal.Length < 2), size = 4, shape = 5, color = "red") +
  geom_point(data = iris %>% filter(Petal.Length > 6), size = 4, shape = 0, color = "red") +
  scale_color_gradient2(low = muted("green"), high = muted("navy"), 
                        mid = "gray80",
                        midpoint = 3, limits = c(2, 6), 
                        na.value = "orange")

If we change midpoint to 3, then the scale truly runs from 2 to 6 and values below 2 are
flagged.

ggplot(mapping = aes(x = Sepal.Length, y = Sepal.Width) ) +
  geom_point(data = iris, aes(color = Petal.Length), size = 2) +
  geom_point(data = iris %>% filter(Petal.Length < 2), size = 4, shape = 5, color = "red") +
  geom_point(data = iris %>% filter(Petal.Length > 6), size = 4, shape = 0, color = "red") +
  scale_color_gradient2(low = muted("green"), high = muted("blue"), 
                        mid = "gray80",
                        midpoint = 4, limits = c(2, 6), 
                        na.value = "orange")
@karawoo
Copy link
Member

karawoo commented Aug 3, 2017

Thanks for opening this issue and including an example. Would you mind including the plot images as well? The reprex package can help streamline this.

@karawoo karawoo added the reprex needs a minimal reproducible example label Aug 3, 2017
@rpruim
Copy link
Author

rpruim commented Aug 3, 2017

Here you go. Notice the color change for NA's when we switch the value of midpoint from plot 1 to plot 2. Things in diamonds or squares should be marked as NA (orange) if limits is being respected tightly.

image

image

@karawoo karawoo added bug an unexpected problem or unintended behavior scales 🐍 and removed reprex needs a minimal reproducible example labels Aug 3, 2017
@foo-bar-baz-qux
Copy link
Contributor

I think the issue is to do with the mid_rescaler which calls scales::rescale_mid. If the midpoint is set correctly to be the middle of the limits, the scaled limits will be [0, 1] such that all points outside the original limits, would also be outside [0, 1]. This leads to the expected result of those points outside the range being marked as NA.

However, the midpoint parameter might not do what is expected here if it is not in the middle of the data; if you look at the scales::rescale_mid function, it effectively changes the range of [0, 1] to correspond to twice the distance from the midpoint to either the minimum or maximum limit (whichever distance is greater). So using a midpoint of 3 instead of 4 in the original example, effectively scales the range [0, 6] down to [0, 1], rather than [2, 6] down to [0, 1] as one might expect. This leads to all points with Petal.Length < 2 to still be displayed since all original petal lengths are > 0, and therefore will still be greater than 0 after the scaling.

If you set the midpoint to 10, you get the opposite effect since now 10 is further from the minimum of the range (2) compared to the maximum of the range (6), so all points with petal length < 2 are considered NA since they will be < 0 in the scaled range.

Some possible solutions (from least to most conservative):

  1. Set the default mid-point as being the middle of the from parameter in the function returned by mid_rescaler.
    • The default of midpoint = 0 can definitely lead to strange results depending on the range of the data. E.g. if the range of the data is 100 - 200, then a 0 midpoint effectively renders the low parameter unused.
  2. Throw a warning in mid_rescaler when mid-point is not in the middle of the range.
  3. Documentation change to reflect behavior when not actually set to the middle of the data range.
    • Perhaps there's a use-case for manually setting the mid-point, but the current behaviour may not be obvious from the documentation

@hadley hadley added the wip work in progress label Nov 14, 2017
@lock lock bot locked as resolved and limited conversation to collaborators Jun 18, 2018
Sign up for free to subscribe to this conversation on GitHub. Already have an account? Sign in.
Labels
bug an unexpected problem or unintended behavior scales 🐍 wip work in progress
Projects
None yet
Development

No branches or pull requests

4 participants