Lagger output plotter
plag is intended to receive a lagger log file from stdin (piped in, can be stream) and requires a --message
to be provided. This message will be matched in the log entries, looking for a start and an end of that session.
e.g.:
{"timestamp":"1485269350.346349239","source":"test-app","message":"test-app.function-1.start","log_level":1,"data":{"session":"2"}}
{"timestamp":"1485269351.347641230","source":"test-app","message":"test-app.function-1.end","log_level":1,"data":{"session":"2"}}
If you want to track the metric above, --message should be test-app.function-1.
start/end marks at the moment are:
- "begin", "start", "starting", "started"
- "finish", "end", "ending", "finished"
plag will then output these metrics to according to the options you provided,
you can use one or more output options at the same time:
log | plag --message my.func --graph --csv out.csv --datadog-...
Output points to a CSV file:
log | plag --message log.message.to.watch --csv out.csv
Output points to datadog:
log | plag --message log.message.to.watch --datadog-api-key KEY --datadog-app-key APP-KEY --datadog-metric-name metric
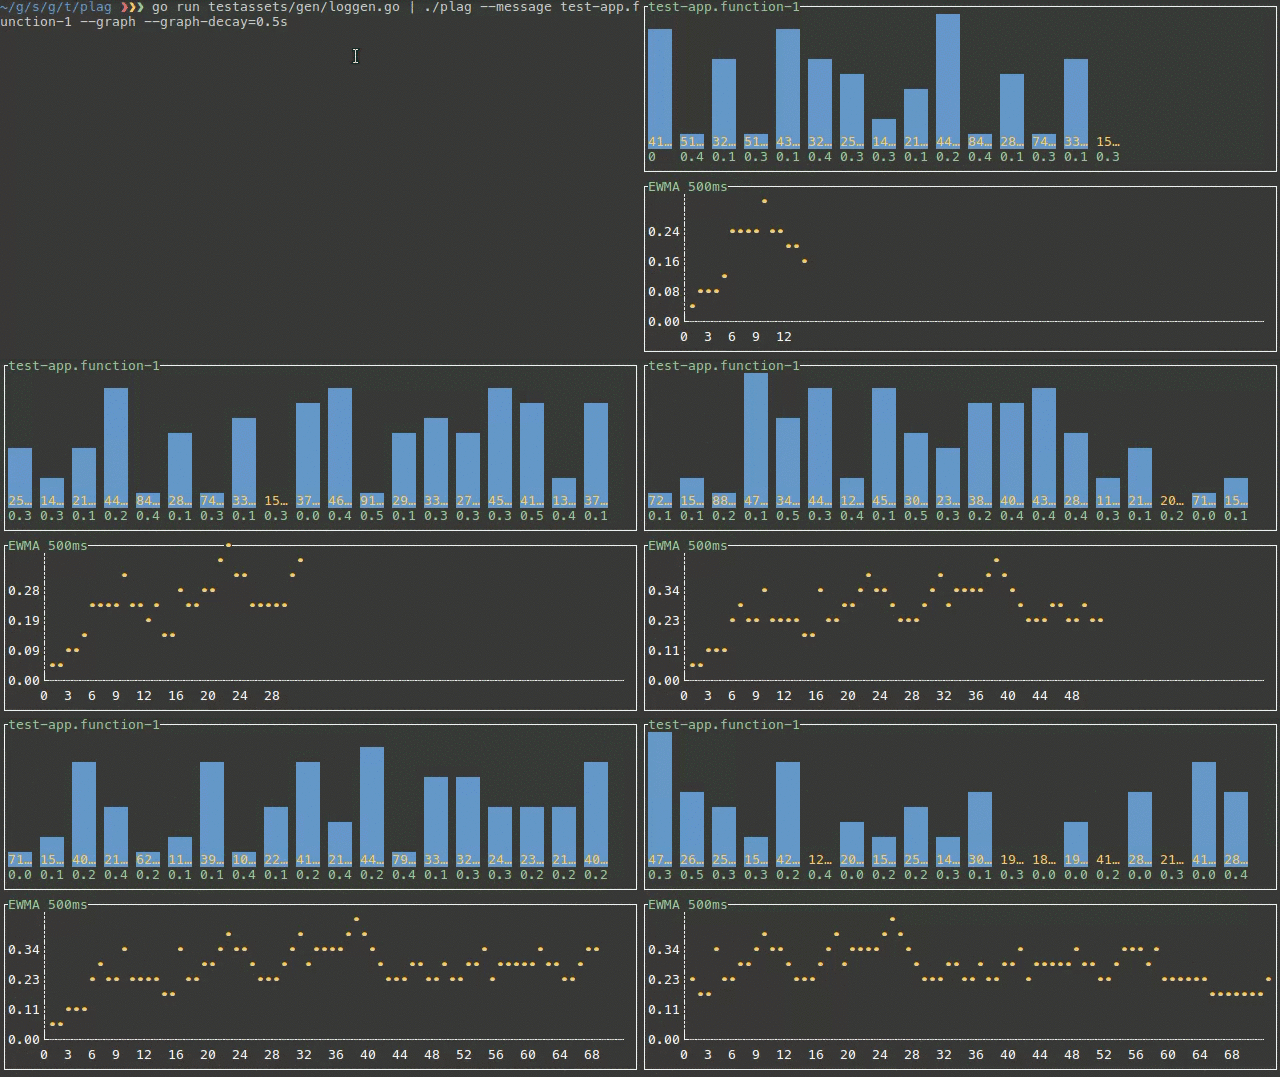
Plot points real-time as a graph on the terminal
log | plag --message log.message.to.watch --graph --graph-decay 20s
--graph-decayis used by the exponentially weighted moving average (ewma) function- pressing
qwill quit the plot
