Monitoring servers using Riemann, Graphite & Grafana.
Tools and processes by which you measure and manage your IT systems.
-
To detect, diagnose and help resolve faults and other issues in your technology environment
-
To understand current state of our product and make technology decisions, and measures the success of those projects
- Example: Your marketing team might decide to increase their spend in advertisement
-
It’s commonly managed via checklists, simple scripts, and other non-automated processes
-
Only components which are broken in past being monitored
-
Here the focus be mainly to minimize downtime
-
It provides little or no value in measuring quality or service and provides little or no data that helps IT justify budgets, costs, or new projects
-
Its common in small organizations with limited IT staffing
-
Automated with some remnants of manual or unmonitored components
-
You will commonly see tools like Nagios with stock checks of basic concerns like disk, CPU and memory
-
Alerting will be based on simple thresholds and sent via email or slack or other messaging services
-
This focuses on measuring availability and managing IT assets
-
It provides some data that measures quality of service and also helps IT justify budgets, costs or new projects
-
Most of the data needs to be manipulated or transformed before it can be used
-
Small number of operationally focused dashboards exist
-
Its common in small to medium sized organizations
-
Considered core to managing infrastructure and the business
-
Monitoring is automatic and generated by configuration management
-
You’ll see tools like Nagios, Sensu, and Graphite with widespread use of metrics
-
Checks will be application centric, with many applications instrumented as part of development
-
Checks will focus on measuring application performance and business outcomes rather than just stock concerns like disk and CPU
-
Performance data will be collected and used frequently for analysis and fault resolution
-
Focus is on measuring quality of service and customer experience
-
Data collected is provided directly to business units, application teams and other relevant parties via dashboards and reports
-
This is common in organization that have adopted a DevOps culture
-
Monitoring will be managed by an operational team but responsibility for ensuring new applications and services to be monitored may be delegated to developers
-
Product is not considered feature complete or ready for deployment without monitoring
A reactive environment generates infrastructure-centric monitoring outputs: a host is down, a service is broken.
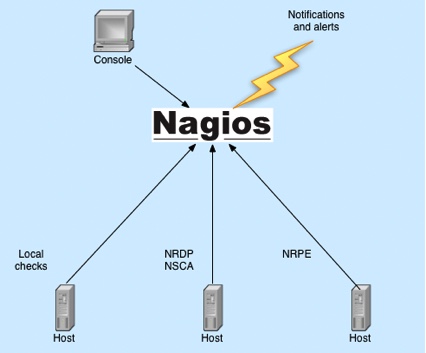
It only serves a segment of our technology customer - generally only operational teams - doesn’t provide useful, application-centric data to developers. Non-operations staff are disconnected from the reality of the performance and availability of the infrastructure and applications being monitored.
So how do we take our typical reactive environment and turn it into a much more palatable proactive environment? Measurement.
We’re going to update our reactive environment to focus on events, metrics, logs. We’ll replace existing monitoring infrastructure - example, service and host-centric checks and replace them with event and metric-driven checks
We rely on metrics instead of fault detection checks..
If a metric is measuring then the service is available. If it stops measuring then it’s likely the service is not available.
-
Allow us to easily visualize the state of our environment.
-
Be event, log, and metrics-centric.
-
Focus on “whitebox” or push-based monitoring instead of “blackbox” or pull-
based monitoring.
-
Provide contextual and useful notifications.
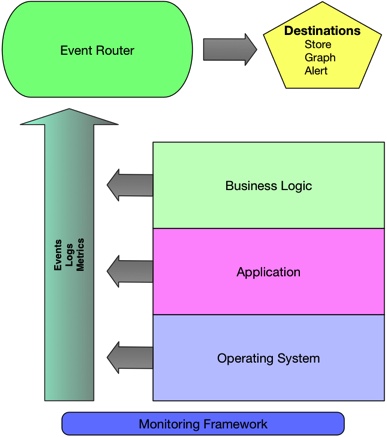
Our new push-centric architecture is going to be centered around collecting event and metric data. We’ll use that data to monitor our environment and detect when things go wrong.
-
Events — We’ll generally use events to let us know about changes and oc- currences in our environment.
-
Logs — Logs are a subset of events. While they’re helpful for letting us know what’s happening, they’re often most useful for fault diagnosis and investigation.
-
Metrics — Of all these data sources, we’ll rely most heavily on metrics to help us understand what’s going on in our environment.