


The goal of this gem is to provide near real time tracking and reporting on the number of users currently online and accessing given application. It requires that the reporting layer is able to uniquely identify each user and provide a unique identifier. It may also optionally assign another dimension to the users accessing, such as, for example, platform -- which in our case denotes how the user is accessing our application: from desktop browser, iOS app, Android app, mobile web, etc. But any other partitioning schemee can be used, or none at all.
The gem uses (and depends on) a Redis instance in order to keep track of unique users, and it stores each user as a triplet of values in a hash key: { unique id, IP address, platform }.
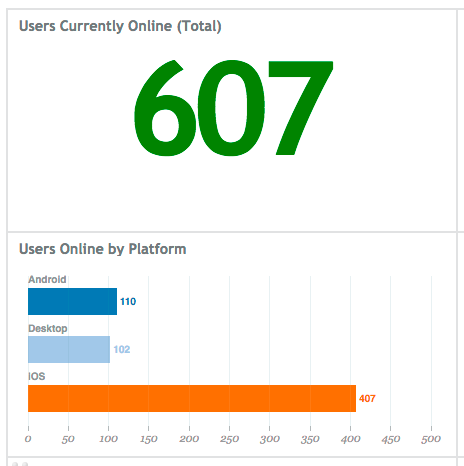
If you use a dashboard to display your current metrics, you could be showing current online users broken down by the platform, like in the image below.
NOTE:, the actual number are from the test application we used to verify accuracy of the gem, and are not a representation of traffic to any public facing application).
Add this line to your application's Gemfile (Note that another gem with a competing name is on RubyGems, so you must specify the path below):
gem 'turnstile', git: 'https://github.com/wanelo/turnstile'
And then execute:
$ bundle
Or install it yourself as:
$ gem install turnstile
Turnstile contains two primary parts: data collection and reporting. Data collection may happen synchronously in real time from a web request across many web servers (as long as they can talk to the redis instance), or off web request by log parsing.
If you prefer to use sampling to estimate number of online users, you
should use Turnstile::Tracker#track method that supports sampling.
If you want to store 100% of your data, you can use Turnstile::Adapter#add instead.
user_id   = 12345
platform  = 'desktop'
ip        = "224.247.12.4"

# Register the fact that user is online without sampling
Turnstile::Adapter.new.add(user_id, platform, ip)
Without any further calls to track() method for this particular user/platform/ip combination, the user
is considered online for 60 seconds. Each subsequent call to track() resets the TTL, and so on and so force.
If adding latency to a web request is not desirable (it was not in our case), another option is to run Turnstile log-watcher process as a daemon, which then "tails" the log file of your application servers. In this mode
log-watcher is scanning for log lines matching a particular pattern, and then extracting user id, IP and platform
based on a configurable regular expression.
The logging approach expects that you print a special token into your log file, which contains 3 column separated fields: platform, IP, user_id, for example 'desktop:125.4.5.13:3456' would be a token extractable from a log file.
For example our log lines look something like this:
2014-04-22 21:21:38.382 77874: info x-rqst | 389447874921382344 | iphone:44.22.12.245:434324:user2345 | 10ms | GET /api/v1/some-api-url .....
The 9th field in that line above contains our token, and "x-rqst" is a special string we include in these log lines that we log for every request. This is why we instantiate the logger as follows:
module Turnstile
  module Collector
    class LogReader

      def self.wanelo_ruby(file, queue)
        new(file, queue, %r{x-rqst}, ->(line){line.split(' ')[8]})
      end
    end
  end
end
You can start a log-watcher process that will tail the log in the wanelo format and will update redis database.
Usage: bundle exec log-watcher -f <file> [options]

    -v, --verbose                    Print status to stdout
    -f, --file FILE                  File to watch
    -h, --redis-host HOST            Redis server host
    -p, --redis-port PORT            Redis server port
    -n, --redis-db DB                Redis server db
    -d, --daemonize                  Should we daemonize
    -b, --buffer-interval INTERVAL   Buffer for this many seconds
    -i, --flush-interval INTERVAL    Flush then sleep for this many seconds
    -?, --help                       Show this message
For example:
> bundle exec log-watcher -v -f log/production/log -h 127.0.0.1 -p 6432 | tee /var/log/turnstile.log

2014-04-12 05:16:41 -0700: updater:flush        - nothing to flush, sleeping 6s..
2014-04-12 05:16:41 -0700: updater:queue        - nothing in the queue, sleeping 5s...
2014-04-12 05:16:41 -0700: log-reader           - starting to tail file log....
2014-04-12 05:16:46 -0700: updater:queue        - nothing in the queue, sleeping 5s...
2014-04-12 05:16:53 -0700: updater:flush        - nothing to flush, sleeping 6s..
2014-04-12 05:16:56 -0700: updater:queue        - (     0.65ms) caching [746] keys locally
2014-04-12 05:16:59 -0700: updater:flush        - (    91.73ms) flushing cache with [602] keys
2014-04-12 05:17:05 -0700: updater:flush        - nothing to flush, sleeping 6s..
^Ctrl-C
Note that ideally you should run log-watcher on all app servers, for completeness, and because
this does not incur any additional cost for the application (as user tracking is happening outside web request).
Once the tracking information is sent, the data can be queried.
If you used sampling, then you should query using Turnstile::Observer class that provides
exprapolation of the results based on sample size configuration.
# Return data for sampled users and the summary
Turnstile::Observer.new.stats
# => { stats: { total: 3, platforms: 2 }, users: [ { uid: 1, platform: 'desktop', ip: '123.2.4.54' }, ... ]
If you did not use sampling, you can get some answers from the Turnstile::Adapter class:
Turntstile::Adapter.new.fetch
# => [ { uid: 213, :platform: 'desktop', '123.2.4.54' }, { uid: 215, ... } ]
You can also request an aggregate results, suitable for sending to graphing systems or displaying on a dashboard:
Turntstile::Adapter.new.aggregate
# => { 'desktop' => 234, 'ios' => 3214, ..., 'total' => 4566 }We use Circonus to collect and graph data. You can use log-watcher
to dump the current aggregate statistics from redis to standard output,
which is a tab-delimited format consumable by the nad daemon.
(below output is formatted to show tabs as aligned for readability).
> bin/log-watcher -h 127.0.0.1 -p 6432 -s
turnstile.iphone	 n      383
turnstile.ipad       n	    34
turnstile.android    n      108
turnstile.ipod_touch n      34
turnstile.unknown    n      36
turnstile.total n 595- Allow users of the gem to easier customize log reader to fit their own custom log files
- Export configuration into a YAML file and load from there by defaul
- Refactor commands to have a single
turnstileCLI with sub-commandswatchandreport.
- Fork it ( http://github.com//turnstile/fork )
- Create your feature branch (
git checkout -b my-new-feature) - Commit your changes (
git commit -am 'Add some feature') - Push to the branch (
git push origin my-new-feature) - Create new Pull Request