This repository contains statistical analysis for boston housing database & machine learning statistical analysis for loan dataset of 346 customers.
Dataset: Boston Housing Dataset
This notebook uses scipy, matplotlib, seaborn and statsmodels.api for effective statistical and visualization analysis.
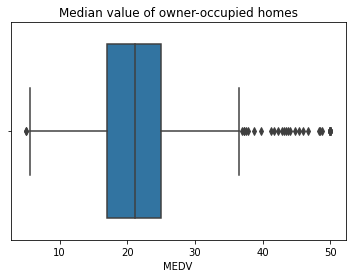
- Median value of owner-occupied homes:
Quartile distribution of the owner occupied homes ranges from 17 to 25, q1 or 25% of range = 17 q2 or 75% of range = 25 and median = 21
- Histogram for the Charles river variable:
Through the histogram we can say that tract bounds river are majorly found
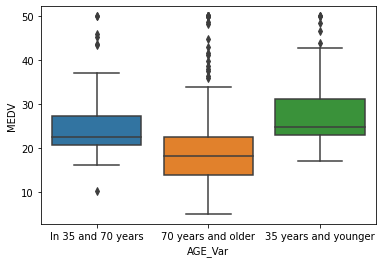
- Boxplot for the MEDV variable vs the AGE variable. (Discretizing the age variable into three groups of 35 years and younger, between 35 and 70 years and 70 years and older):
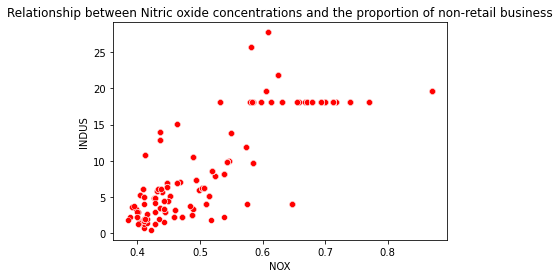
- Scatter plot to show the relationship between Nitric oxide concentrations and the proportion of non-retail business acres per town:
A linear relationship is seen between Nitric oxide concentrations and the proportion of non-retail business.
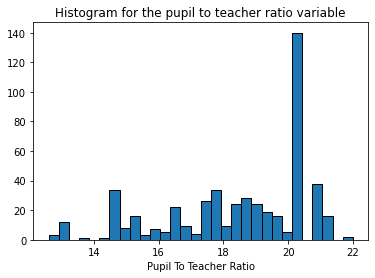
- Histogram for the pupil to teacher ratio variable:
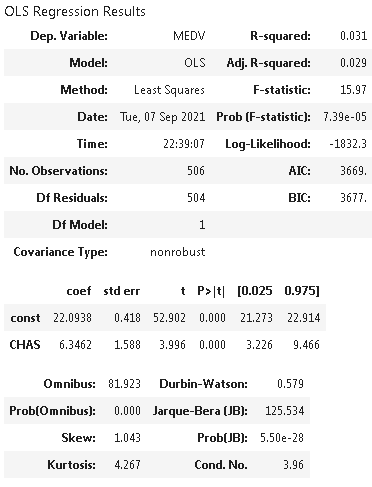
- Is there a significant difference in median value of houses bounded by the Charles river or not?
Hypothesis:
H0:There is no significant difference in the mean values of median value of houses and Charles river variables (Null Hypothesis)
H1:There is a significant difference in the mean values of median value of houses and Charles river variables
Conclusion: Here we get to confirm that the P value is 0 which without doubt less than 0.05 thus we can reject our null hypothesis and opt the other hypothesis
- Is there a difference in Median values of houses (MEDV) for each proportion of owner occupied units built prior to 1940 (AGE)?
Hypothesis
H0: All age groups have same mean values (Null Hypothesis)
H1: Atleast one age group mean differs
Resut: F_statistic:36.40764999196599, P-value:1.7105011022702984e-15
Conclusion: Here we get to know the P value is 1.7105011022702984e-15 which is less than 0.05 therefore we reject the null hypothesis and opt the other hypothesis
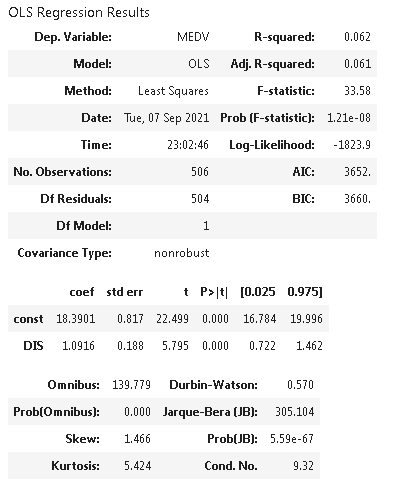
- What is the impact of an additional weighted distance to the five Boston employment centres on the median value of owner occupied homes?
Hypothesis
H0: There is no impact of an additional weighted distance to the five Boston employment centres on the median value of owner occupied homes (Null Hypothesis)
H1: There is an impact of an additional weighted distance to the five Boston employment centres on the median value of owner occupied homes
Conclusion: Here we get to know the P value is 1.21e-08 which is less than 0.05 therefore we reject the null hypothesis and see that for every additional weighted distance, median value of owner occupied homes increases by 1.09 unit
Dataset: Loan_Dataset
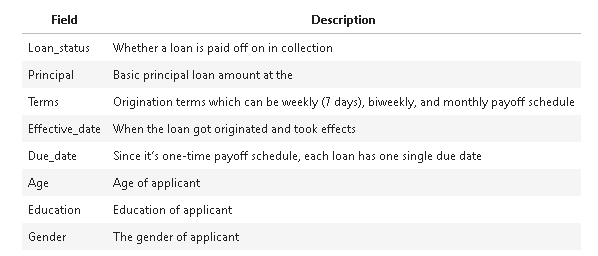
About dataset: This dataset is about past loans. The Loan_train.csv data set includes details of 346 customers whose loan are already paid off or defaulted. It includes following fields:
This notebook uses scikit-learn, matplotlib, itertools, pandas and numpy for effective statistical and visualization analysis.
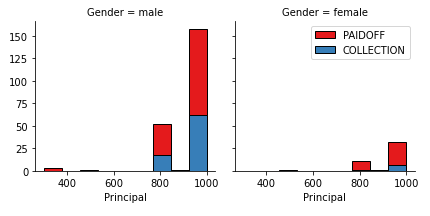
- Visualization of principal amount and loan_status while considering both genders differently:
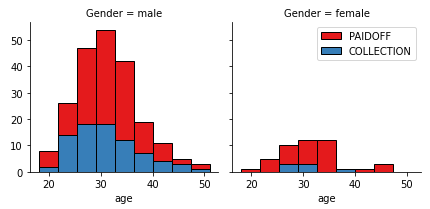
- Visualization of age and loan_status while considering both genders differently:
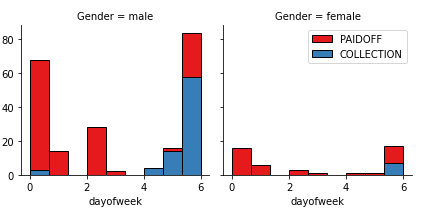
- Visualization of dayofweek and loan_status while considering both genders differently:
- K Nearest Neighbor(KNN)
- Decision Tree
- Support Vector Machine
- Logistic Regression
- KNN: The best accuracy was 0.7857142857142857 with k= 7
- Decision Tree: DecisionTrees's Accuracy: 0.6142857142857143
- Logistic Regression Modelling: LogisticRegression(C=0.01, solver='liblinear')
Loan Dataset for testing: Test_Dataset
-
KNN:
Jaccard Score: 0.6041666666666666
F1-Score: 0.658318980899626 -
Decision Tree:
Jaccard Score: 0.6590909090909091
F1-Score: 0.7366818873668188 -
SVM:
Jaccard Score: 0.78
F1-Score: 0.7583503077293734 -
Logistic Regression:
Jaccard Score: 0.7358490566037735
F1-Score: 0.6604267310789049
Log Loss: 0.5672153379912981
