Second Tutorial Part 12: One Last Thing...
| Previous | Main | Next |
|---|---|---|
| <-- Part 11 | Main |
Performance is something that we care a lot about day to day, and the only way to do performance right is to measure. Although Tilda strives to remain transparent with regards to how the database is accessed, and the generated SQL, it' still important to understand all the performance-related pieces in details.
Tilda's generated code is fully instrumented and simple APIs are available to get to that information. A simple piece of code allows you to access an HTML-rendered table with the information:
private static void test6()
throws Exception
  {
    Writer out = new PrintWriter(System.out);
    PerfTracker.print(out);
  }
🎈 NOTE: There is also a version of the print method that takes a StringBuilder in case you need more control over how the results get output.
For our sample where we invoke simply test1a and test1b, the results look as follows:
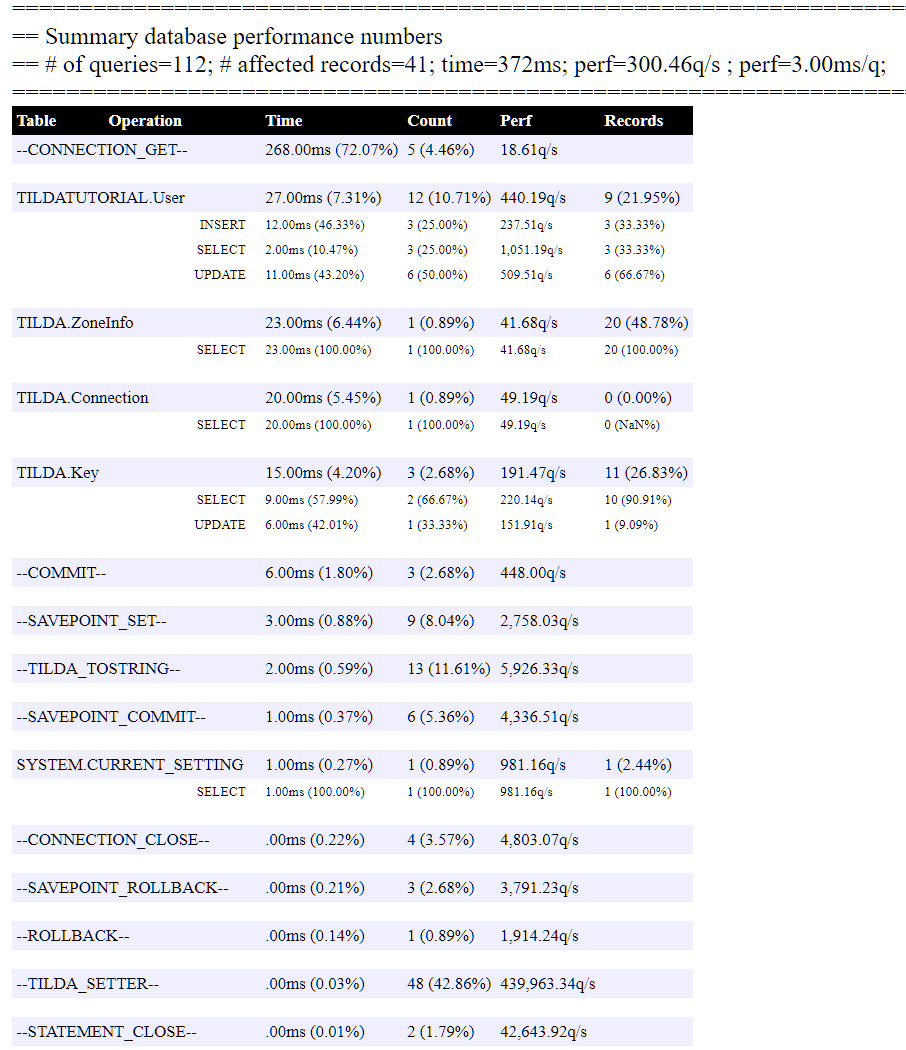
Tilda automatically instruments the following operations:
- Inserts/Updates/Selects/Deletes for all tables/views accessed
- Setters, Getters and toString() on Data objects
- Savepoints, Commits and Rollbacks
- Statement closing and resource de-allocation (like statement arrays).
- Connection management
In our example, you can see all aspects of the Tilda runtime and how much time each takes. You can further tune your system for better data access patterns, monitor query counts and performance, and keep track of extras such as savepoints and commit/rollback times, i.e., too many transactions, or transactions that are too big.
🎈 NOTE: In a future feature, we have discussed a JSON output for this data.
🎈 NOTE: In a future feature, we have discussed a timer-based snap-shoting of the data to the database for historical tracking.
If you want to go deep, there are a number of APIs that you can use for more details. Here for example is pretty much what the print method does:
Writer out = new PrintWriter(System.out);

Info[] C = PerfTracker.getPerfLogSnapshot();
long TotalCount = 0;
long TotalRecords = 0;
long TotalNano = 0;
int MaxTableNameLength = 0;
for (Info T : C)
  {
    TotalCount += T.getCountTotal();
    TotalRecords += T.getRecordsTotal();
    TotalNano += T.getNanoTotal();
    if (T.getName().length() > MaxTableNameLength)
      MaxTableNameLength = T.getName().length();
  }

out.append("<BR>\r\n\r\n")
.append("====================================================================================<BR>\r\n")
.append("==  Summary database performance numbers<BR>\r\n")
.append("==  # of queries=").append(NumberFormatUtil.printWith000Sep(TotalCount))
.append("; # affected records=").append(NumberFormatUtil.printWith000Sep(TotalRecords))
.append("; time=").append(DurationUtil.printDuration(TotalNano))
.append("; perf=").append(DurationUtil.printPerformancePerSecond(TotalNano, TotalCount)).append("q/s ")
.append("; perf=").append(DurationUtil.printDurationMilliSeconds(TotalCount == 0 ? 0 : TotalNano / TotalCount))
.append("/q; ").append("<BR>\r\n")
.append("====================================================================================<BR>\r\n")
.append("<TABLE style=\"font-size: 70%;\" cellpadding=\"3px\" cellspacing=\"0px\" border=\"0px\">\r\n")
.append("<TR style=\"background-color: #000; color: #FFF; font-weight: bold;\">\r\n")
.append("<TD>Table</TD><TD>Operation</TD><TD>Time</TD><TD>Count</TD><TD>Perf</TD><TD>Records</TD>\r\n")
.append("</TR>\r\n");

Arrays.sort(C, new TableInfoByTime());
for (Info T : C)
  T.print(out, TotalCount, TotalRecords, TotalNano);
out.append("</TABLE>\r\n");
Check the Tilda JavaDocs API documentation for additional details.
| Previous | Main | Next |
|---|---|---|
| <-- Part 11 | Main |