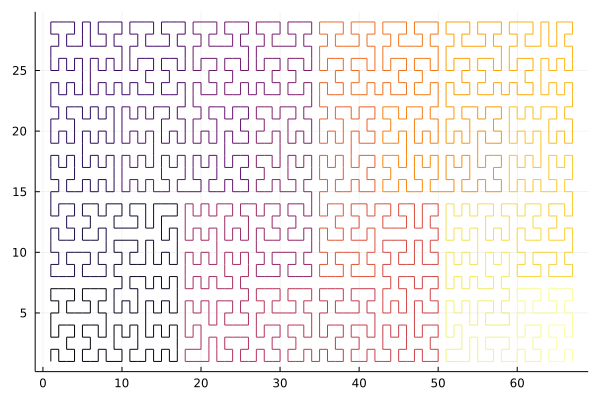
This is a Julia implementation of the generalized Hilbert ("gilbert") space-filling curve algorithm, by Jakub Červený (https://github.com/jakubcerveny/gilbert). It provides space-filling curves for rectangular domains of arbitrary (non-power-of-two) sizes. Currently only 2D domains are supported, but it could be extended to 3D.
Currently it exports one function, gilbertindices which returns a vector of
CartesianIndex{2} objects corresponding to their order on the curve:
julia> using GilbertCurves

julia> list = gilbertindices((5,5))
25-element Vector{CartesianIndex{2}}:
 CartesianIndex(1, 1)
 CartesianIndex(2, 1)
 CartesianIndex(2, 2)
 CartesianIndex(1, 2)
 CartesianIndex(1, 3)
 CartesianIndex(1, 4)
 CartesianIndex(1, 5)
 ⋮
 CartesianIndex(5, 3)
 CartesianIndex(5, 2)
 CartesianIndex(4, 2)
 CartesianIndex(3, 2)
 CartesianIndex(3, 1)
 CartesianIndex(4, 1)
 CartesianIndex(5, 1)
Two non-exported functions are also provided. GilbertCurves.linearindices takes the output of
gilbertindices, returning an integer-valued matrix of the gilbert indices of each component.
julia> GilbertCurves.linearindices(list)
5×5 Matrix{Int64}:
  1   4   5   6   7
  2   3  10   9   8
 23  22  11  12  13
 24  21  18  17  14
 25  20  19  16  15
GilbertCurves.gilbertorder constructs a vector containing the elements of a matrix in the
gilbert curve order.
julia> GilbertCurves.gilbertorder(reshape(1:9,3,3))
9-element Vector{Int64}:
 1
 4
 7
 8
 9
 6
 5
 2
3julia> using Plots
julia> list = gilbertindices((67,29));
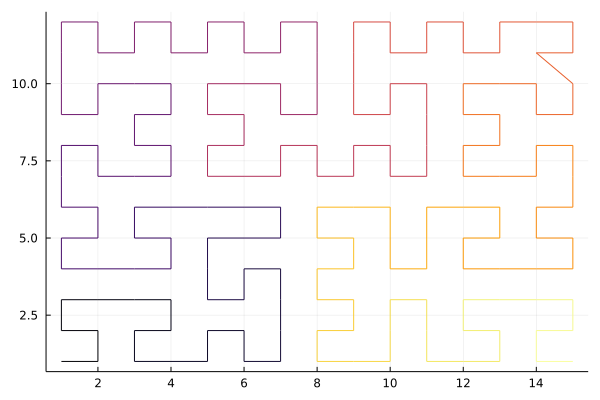
julia> plot([c[1] for c in list], [c[2] for c in list], line_z=1:length(list), legend=false)The algorithm is not able to avoid non-diagonal moves in the case when the larger dimension is odd and the smaller is even.
julia> list = gilbertindices((15,12));

julia> plot([c[1] for c in list], [c[2] for c in list], line_z=1:length(list), legend=false)
