Visualization tools take many forms. An excellent article comparing the leading visualization packages is here: http://pbpython.com/visualization-tools-1.html.
While our attempt to learn Python in 5 (well 20) minutes last session was fairly fantastical, getting a full grasp of Python's plotting and visualization capabilities in under an hour is even more ridiculous. I've been digging in myself for several weeks and still feel only slightly competent! Constructing visualizations via code simply has many, many moving parts and thus has a bit of a steep learning curve.
So. Rather than attempt even a cursory survey of the Python visualization packages, we are going to keep things simple here and just do a gentle introduction using a bit of Matplotlib (the so-called 'grandfather' of Python visualization packages), Pandas, and Seaborn. This should get you beyond the initial hump in the learning curve and also provide context for a discussion on the key elements of constructing visualizations. I'm afraid to say that, just past this initial introduction, this initial bump, is a much more complicated discussion of figures and axes, the grammar of graphics, and a host of installation and setup hoops that would take much longer than a few hours to get past successfully. That said, we've provided a number of visualization examples in the scripts and notebooks presented in previous sessions.
And now, let's dive in. You'll need to fire up your Python Jupyter container and upload the two Jupyter notebooks we'll be using. Here's the lowdown:
- Log in to the VM Manage web site: https://vm-manage.oit.duke.edu/containers
- Fire up to your Jupyter Environment: https://vm-manage.oit.duke.edu/containers/jupyter
- In your Jupyter environment, click
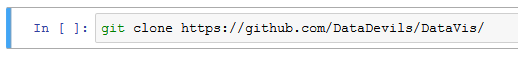
New ▼and selectBashto create a new Bash script. - In the Bash script box, type:
git clone https://github.com/DataDevils/DataVis/
-
Hit
►|to run the script which will download the notebook and data you need for the lesson. These will be stored in a folder calledDataVisin your Juptyer environment. -
Close the Bash script.
-
Open the
DataVisfolder and open theVisualization-in-Python.ipynbnotebook. We'll do the rest from there...