The Iris flower data set is a set of infomation that was made by the satastician Ronald Fischer in 1936. The data set describes particular biological characteristics of several types of iris flowers reproductive systems. These involve the length and width of both petals and sepals.This data set is now commonly used as for testing purpose in computer science. In paper "The use of multiple measruements in taxonomic problems", Ronald Fischer took 50 samples from each of three species of Iris flowers from the Gaspe Peninsula "all from the same pasture, and picked on the same day and measured at the same time by the same person with the same apparatus". The 3 species of the Iris flowers were the "Isis setosa", "Iris Virginica" and "Iris Versicolor" (fig 1).
The length and width of the sepals and petals were measured in centimeters and the data was added in a table (fig 2). The table was split into 6 colums that included the "Dataset Order", "Sepal length (cm)", "Sepal width (cm)", "Petal length (cm)", "Petal width (cm)" and "Flower Species". The result of all the data collected was a linear model that was able tell apart the different species from each other.
Fisher's Iris Data

Dataset Order    Sepal length    Sepal width    Petal length    Petal width    Flower Species
1	5.1	3.5	1.4	0.2	I. setosa
2	4.9	3.0	1.4	0.2	I. setosa
3	4.7	3.2	1.3	0.2	I. setosa
4	4.6	3.1	1.5	0.2	I. setosa
5	5.0	3.6	1.4	0.3	I. setosa
6	5.4	3.9	1.7	0.4	I. setosa
7	4.6	3.4	1.4	0.3	I. setosa
8	5.0	3.4	1.5	0.2	I. setosa
9	4.4	2.9	1.4	0.2	I. setosa
10	4.9	3.1	1.5	0.1	I. setosa
11	5.4	3.7	1.5	0.2	I. setosa
12	4.8	3.4	1.6	0.2	I. setosa
13	4.8	3.0	1.4	0.1	I. setosa
14	4.3	3.0	1.1	0.1	I. setosa
15	5.8	4.0	1.2	0.2	I. setosa
16	5.7	4.4	1.5	0.4	I. setosa
17	5.4	3.9	1.3	0.4	I. setosa
18	5.1	3.5	1.4	0.3	I. setosa
19	5.7	3.8	1.7	0.3	I. setosa
20	5.1	3.8	1.5	0.3	I. setosa
21	5.4	3.4	1.7	0.2	I. setosa
22	5.1	3.7	1.5	0.4	I. setosa
23	4.6	3.6	1.0	0.2	I. setosa
24	5.1	3.3	1.7	0.5	I. setosa
25	4.8	3.4	1.9	0.2	I. setosa
26	5.0	3.0	1.6	0.2	I. setosa
27	5.0	3.4	1.6	0.4	I. setosa
28	5.2	3.5	1.5	0.2	I. setosa
29	5.2	3.4	1.4	0.2	I. setosa
30	4.7	3.2	1.6	0.2	I. setosa
31	4.8	3.1	1.6	0.2	I. setosa
32	5.4	3.4	1.5	0.4	I. setosa
33	5.2	4.1	1.5	0.1	I. setosa
34	5.5	4.2	1.4	0.2	I. setosa
35	4.9	3.1	1.5	0.2	I. setosa
36	5.0	3.2	1.2	0.2	I. setosa
37	5.5	3.5	1.3	0.2	I. setosa
38	4.9	3.6	1.4	0.1	I. setosa
39	4.4	3.0	1.3	0.2	I. setosa
40	5.1	3.4	1.5	0.2	I. setosa
41	5.0	3.5	1.3	0.3	I. setosa
42	4.5	2.3	1.3	0.3	I. setosa
43	4.4	3.2	1.3	0.2	I. setosa
44	5.0	3.5	1.6	0.6	I. setosa
45	5.1	3.8	1.9	0.4	I. setosa
46	4.8	3.0	1.4	0.3	I. setosa
47	5.1	3.8	1.6	0.2	I. setosa
48	4.6	3.2	1.4	0.2	I. setosa
49	5.3	3.7	1.5	0.2	I. setosa
50	5.0	3.3	1.4	0.2	I. setosa
51	7.0	3.2	4.7	1.4	I. versicolor
52	6.4	3.2	4.5	1.5	I. versicolor
53	6.9	3.1	4.9	1.5	I. versicolor
54	5.5	2.3	4.0	1.3	I. versicolor
55	6.5	2.8	4.6	1.5	I. versicolor
56	5.7	2.8	4.5	1.3	I. versicolor
57	6.3	3.3	4.7	1.6	I. versicolor
58	4.9	2.4	3.3	1.0	I. versicolor
59	6.6	2.9	4.6	1.3	I. versicolor
60	5.2	2.7	3.9	1.4	I. versicolor
61	5.0	2.0	3.5	1.0	I. versicolor
62	5.9	3.0	4.2	1.5	I. versicolor
63	6.0	2.2	4.0	1.0	I. versicolor
64	6.1	2.9	4.7	1.4	I. versicolor
65	5.6	2.9	3.6	1.3	I. versicolor
66	6.7	3.1	4.4	1.4	I. versicolor
67	5.6	3.0	4.5	1.5	I. versicolor
68	5.8	2.7	4.1	1.0	I. versicolor
69	6.2	2.2	4.5	1.5	I. versicolor
70	5.6	2.5	3.9	1.1	I. versicolor
71	5.9	3.2	4.8	1.8	I. versicolor
72	6.1	2.8	4.0	1.3	I. versicolor
73	6.3	2.5	4.9	1.5	I. versicolor
74	6.1	2.8	4.7	1.2	I. versicolor
75	6.4	2.9	4.3	1.3	I. versicolor
76	6.6	3.0	4.4	1.4	I. versicolor
77	6.8	2.8	4.8	1.4	I. versicolor
78	6.7	3.0	5.0	1.7	I. versicolor
79	6.0	2.9	4.5	1.5	I. versicolor
80	5.7	2.6	3.5	1.0	I. versicolor
81	5.5	2.4	3.8	1.1	I. versicolor
82	5.5	2.4	3.7	1.0	I. versicolor
83	5.8	2.7	3.9	1.2	I. versicolor
84	6.0	2.7	5.1	1.6	I. versicolor
85	5.4	3.0	4.5	1.5	I. versicolor
86	6.0	3.4	4.5	1.6	I. versicolor
87	6.7	3.1	4.7	1.5	I. versicolor
88	6.3	2.3	4.4	1.3	I. versicolor
89	5.6	3.0	4.1	1.3	I. versicolor
90	5.5	2.5	4.0	1.3	I. versicolor
91	5.5	2.6	4.4	1.2	I. versicolor
92	6.1	3.0	4.6	1.4	I. versicolor
93	5.8	2.6	4.0	1.2	I. versicolor
94	5.0	2.3	3.3	1.0	I. versicolor
95	5.6	2.7	4.2	1.3	I. versicolor
96	5.7	3.0	4.2	1.2	I. versicolor
97	5.7	2.9	4.2	1.3	I. versicolor
98	6.2	2.9	4.3	1.3	I. versicolor
99	5.1	2.5	3.0	1.1	I. versicolor
100	5.7	2.8	4.1	1.3	I. versicolor
101	6.3	3.3	6.0	2.5	I. virginica
102	5.8	2.7	5.1	1.9	I. virginica
103	7.1	3.0	5.9	2.1	I. virginica
104	6.3	2.9	5.6	1.8	I. virginica
105	6.5	3.0	5.8	2.2	I. virginica
106	7.6	3.0	6.6	2.1	I. virginica
107	4.9	2.5	4.5	1.7	I. virginica
108	7.3	2.9	6.3	1.8	I. virginica
109	6.7	2.5	5.8	1.8	I. virginica
110	7.2	3.6	6.1	2.5	I. virginica
111	6.5	3.2	5.1	2.0	I. virginica
112	6.4	2.7	5.3	1.9	I. virginica
113	6.8	3.0	5.5	2.1	I. virginica
114	5.7	2.5	5.0	2.0	I. virginica
115	5.8	2.8	5.1	2.4	I. virginica
116	6.4	3.2	5.3	2.3	I. virginica
117	6.5	3.0	5.5	1.8	I. virginica
118	7.7	3.8	6.7	2.2	I. virginica
119	7.7	2.6	6.9	2.3	I. virginica
120	6.0	2.2	5.0	1.5	I. virginica
121	6.9	3.2	5.7	2.3	I. virginica
122	5.6	2.8	4.9	2.0	I. virginica
123	7.7	2.8	6.7	2.0	I. virginica
124	6.3	2.7	4.9	1.8	I. virginica
125	6.7	3.3	5.7	2.1	I. virginica
126	7.2	3.2	6.0	1.8	I. virginica
127	6.2	2.8	4.8	1.8	I. virginica
128	6.1	3.0	4.9	1.8	I. virginica
129	6.4	2.8	5.6	2.1	I. virginica
130	7.2	3.0	5.8	1.6	I. virginica
131	7.4	2.8	6.1	1.9	I. virginica
132	7.9	3.8	6.4	2.0	I. virginica
133	6.4	2.8	5.6	2.2	I. virginica
134	6.3	2.8	5.1	1.5	I. virginica
135	6.1	2.6	5.6	1.4	I. virginica
136	7.7	3.0	6.1	2.3	I. virginica
137	6.3	3.4	5.6	2.4	I. virginica
138	6.4	3.1	5.5	1.8	I. virginica
139	6.0	3.0	4.8	1.8	I. virginica
140	6.9	3.1	5.4	2.1	I. virginica
141	6.7	3.1	5.6	2.4	I. virginica
142	6.9	3.1	5.1	2.3	I. virginica
143	5.8	2.7	5.1	1.9	I. virginica
144	6.8	3.2	5.9	2.3	I. virginica
145	6.7	3.3	5.7	2.5	I. virginica
146	6.7	3.0	5.2	2.3	I. virginica
147	6.3	2.5	5.0	1.9	I. virginica
148	6.5	3.0	5.2	2.0	I. virginica
149	6.2	3.4	5.4	2.3	I. virginica
150	5.9	3.0	5.1	1.8	I. virginica
To further incestigate the data, I will be using several python based programs which are "Pandas","NumPy", and"Holoviews". Pandas will be used for data maninulation and analysis, NumPy will be used as a library that contains a large collection of high level mathematical funcations and Holoviews will be used to make the data analysis and visualization easy.
import pandas as pd
import numpy as np
import seaborn as sns
Next step is to import the iris.csv using the library from the pandas doftware and examine the first few rows of data. iris_data = pd.read_csv('assets/iris.csv') iris_data.columns = ['sepal_length', 'sepal_width' , 'petal_length', 'petal_width', 'species']
#you can specific the number to show here iris_data.head(10)
Shape of Table To find out the sape of the table, we use this code
iris_data.shape
Finding out the unique types of flower and the amount This code is used to find out the 3 types of flowers used in the analysis. This is used to summarize the typical values in a dataset as well as other aggregates that are useful as well.
iris_data['species'].unique() print(iris_data.groupby('species').size())
Investigating the Irish Data
The data is analysed by using the Min,Max,Mean,Median and standard deviation
iris_data.min()
iris_data.max()
iris_data.mean()
iris_data.median()
iris_data.std()
The resultimg table presents an easier way to present the data. The next step will be to use the box plots and scatter plots to see if each of the sizes are realated ti the species of iris flower.
summary = iris_data.describe() summary = summary.transpose() summary.head()
	Id	SepalLengthCm	SepalWidthCm	PetalLengthCm	PetalWidthCm
count	150.000000	150.000000	150.000000	150.000000	150.000000
mean	75.500000	5.843333	3.054000	3.758667	1.198667
std	43.445368	0.828066	0.433594	1.764420	0.763161
min	1.000000	4.300000	2.000000	1.000000	0.100000
25%	38.250000	5.100000	2.800000	1.600000	0.300000
50%	75.500000	5.800000	3.000000	4.350000	1.300000
75%	112.750000	6.400000	3.300000	5.100000	1.800000
max	150.000000	7.900000	4.400000	6.900000	2.500000
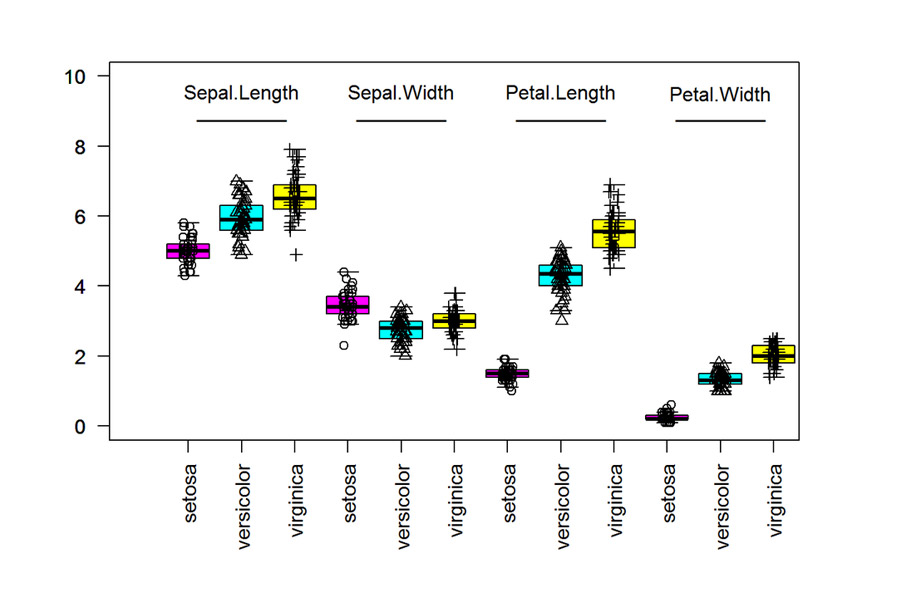
The Boxplots are used to summarise the data length through each of the measurements. Each of the plots will be based on Sepal length, Sepal Width, Petal Length and Petal Width. Based on the data, we can see there are distinct differences between the lenghts and widths of each of the species.
build the box plot
data(iris)
# create boxplots
boxplot(Sepal.Length ~ Species, data = iris, ylim = c(0, 10), xlim = c(0, 12), at = 1:3, outline = FALSE, col = c(6, 5, 7), las = 2)
boxplot(Sepal.Width ~ Species, data = iris, at = 4:6, add = TRUE, outline = FALSE, col = c(6, 5, 7), las = 2)
boxplot(Petal.Length ~ Species, data = iris, at = 7:9, add = TRUE, outline = FALSE, col = c(6, 5, 7), las = 2)
boxplot(Petal.Width ~ Species, data = iris, at = 10:12, add = TRUE, outline = FALSE, col = c(6, 5, 7), las = 2)
# add points
stripchart(Sepal.Length ~ Species, vertical = TRUE, data = iris, method = "jitter", add = TRUE, pch = c(1, 2, 3), at = 1:3)
stripchart(Sepal.Width ~ Species, vertical = TRUE, data = iris, method = "jitter", add = TRUE, pch = c(1, 2, 3), at = 4:6)
stripchart(Petal.Length ~ Species, vertical = TRUE, data = iris, method = "jitter", add = TRUE, pch = c(1, 2, 3), at = 7:9)
stripchart(Petal.Width ~ Species, vertical = TRUE, data = iris, method = "jitter", add = TRUE, pch = c(1, 2, 3), at = 10:12)
# add text
text(2, 9.5, labels = "Sepal.Length")
text(5, 9.5, labels = "Sepal.Width")
text(8, 9.5, labels = "Petal.Length")
text(11, 9.5, labels = "Petal.Width")
text(2, 8.75, labels = "________")
text(5, 8.75, labels = "________")
text(8, 8.75, labels = "________")
text(11, 8.75, labels = "________")
The data can also be analysed by the use of a histogram
import matplotlib.pyplot as plt
from sklearn import datasets
iris= datasets.load_iris()

fig, axes = plt.subplots(nrows= 2, ncols=2)
colors= ['blue', 'red', 'green']

for i, ax in enumerate(axes.flat):
    for label, color in zip(range(len(iris.target_names)), colors):
        ax.hist(iris.data[iris.target==label, i], label=
                            iris.target_names[label], color=color)
        ax.set_xlabel(iris.feature_names[i])
        ax.legend(loc='upper right')


plt.show()
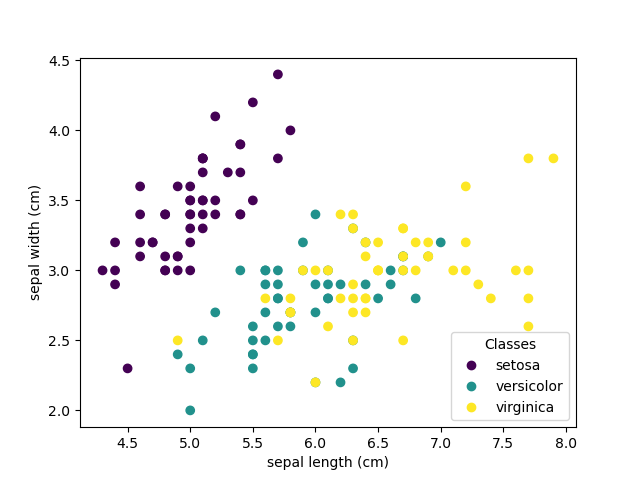
The scatterplot of the statistics is used to spot the structured relationships between the input variables.
scatter plot matrix
import matplotlib.pyplot as plt
import seaborn as sns
iris = sns.load_dataset("iris")
iris["ID"] = iris.index
iris["ratio"] = iris["sepal_length"]/iris["sepal_width"]

sns.lmplot(x="ID", y="ratio", data=iris, hue="species", fit_reg=False, legend=False)

plt.legend()
plt.show()
The pairplot chart helps us to quickly see the relationship between the variables across multiple dimensions using scatterplots and histograms.
>>> import seaborn as sns; sns.set(style="ticks", color_codes=True)
>>> iris = sns.load_dataset("iris")
>>> g = sns.pairplot(iris)
Plotting regression and confidence intervals
g = sns.pairplot(iris, kind="reg")
g = sns.pairplot(iris, hue="species")
sns.set()
%matplotlib incline
# Later in the course I shall explain why ablove 2 lines of code have been added

sns.swarmplot(x="species", y="Petal_length", data=iris)
The Violin plot is used to help visualise the distribution of the dats and its density. The thick black bar in the center represents the interquartile range, the thin black line extended from it represents the 95% confidence intervals, and the white dot is the median.
Once we collect all the data from the analysis, we then use Scikit-Learn to perform machine learning. The steps to perform the learning are as follows.
- Import data
- Investigate data
- Perform supervised learning with K-Nearest Neighbours (KNN)
- Fitting the Model
- Predict the response.
import matplotlib.pyplot as plt from mpl_toolkits.mplot3d import Axes3D from sklearn import datasets from sklearn.decomposition import PCA
#import some data to play with

iris = datasets.load_iris()
X = iris.data[:, :2]  # we only take the first two features.
y = iris.target

x_min, x_max = X[:, 0].min() - .5, X[:, 0].max() + .5
y_min, y_max = X[:, 1].min() - .5, X[:, 1].max() + .5

plt.figure(2, figsize=(8, 6))
plt.clf()

 Plot the training points
plt.scatter(X[:, 0], X[:, 1], c=y, cmap=plt.cm.Set1,
            edgecolor='k')
plt.xlabel('Sepal length')
plt.ylabel('Sepal width')

plt.xlim(x_min, x_max)
plt.ylim(y_min, y_max)
plt.xticks(())
plt.yticks(())

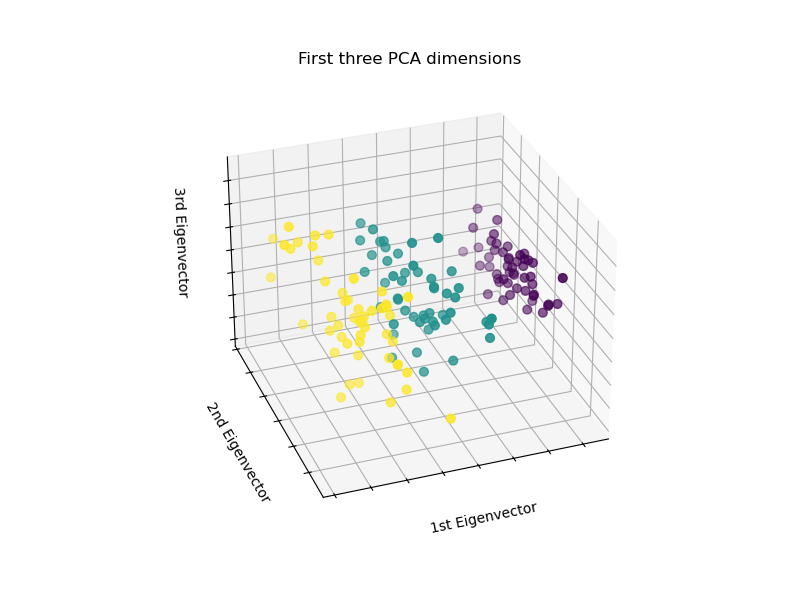
# To getter a better understanding of interaction of the dimensions
# plot the first three PCA dimensions
fig = plt.figure(1, figsize=(8, 6))
ax = Axes3D(fig, elev=-150, azim=110)
X_reduced = PCA(n_components=3).fit_transform(iris.data)
ax.scatter(X_reduced[:, 0], X_reduced[:, 1], X_reduced[:, 2], c=y,
           cmap=plt.cm.Set1, edgecolor='k', s=40)
ax.set_title("First three PCA directions")
ax.set_xlabel("1st eigenvector")
ax.w_xaxis.set_ticklabels([])
ax.set_ylabel("2nd eigenvector")
ax.w_yaxis.set_ticklabels([])
ax.set_zlabel("3rd eigenvector")
ax.w_zaxis.set_ticklabels([])

plt.show()
Using supervised learning with K-Nearest Neighbours(KNN), we are able to ask the algorithm "Based on these measurements, what is the species?"
How do we find out what kind of iris has a 3x5 depal and a 4X2 petal?
knn.predict([[3, 5, 4, 2]])
The answer we get is "Virginica"
Background infomation: https://www.kaggle.com/arshid/iris-flower-dataset https://www.techopedia.com/definition/32880/iris-flower-data-set https://en.wikipedia.org/wiki/Iris_flower_data_set https://medium.com/codebagng/basic-analysis-of-the-iris-data-set-using-python-2995618a6342 http://holoviews.org/ https://en.wikipedia.org/wiki/NumPy https://en.wikipedia.org/wiki/Pandas_(software)
Analysis: https://www.ritchieng.com/machine-learning-iris-dataset/ https://jakevdp.github.io/PythonDataScienceHandbook/02.04-computation-on-arrays-aggregates.html https://www.kaggle.com/bharath25/descriptive-statistics-and-machine-learning-iris https://datascienceplus.com/box-plots-identify-outliers/ https://www.researchgate.net/figure/Side-by-side-boxplots-for-the-marginal-data-of-the-Iris-data-set-by-species_fig2_319857909 https://stackoverflow.com/questions/45721083/unable-to-plot-4-histograms-of-iris-dataset-features-using-matplotlib https://stackoverflow.com/questions/45862223/use-different-colors-in-scatterplot-for-iris-dataset https://seaborn.pydata.org/generated/seaborn.pairplot.html https://medium.com/@neuralnets/data-visualization-with-python-and-seaborn-part-1-29c9478a8700 http://rstudio-pubs-static.s3.amazonaws.com/321676_20be34434fe44ed2b229eadeabe0eb98.html http://www.lac.inpe.br/~rafael.santos/Docs/R/CAP394/WholeStory-Iris.html https://scikit-learn.org/stable/auto_examples/datasets/plot_iris_dataset.html https://scikit-learn.org/stable/auto_examples/linear_model/plot_iris_logistic.html#sphx-glr-auto-examples-linear-model-plot-iris-logistic-py https://www.homeworkhelponline.net/blog/programming/base-r-boxplot-example
Images: http://www.lac.inpe.br/~rafael.santos/Docs/R/CAP394/WholeStory-Iris.html


