Show interactive iteration vs. score plot when using fit() #134
Conversation
|
@christopherbunn this should show best score by iteration. so it should be either monotonically increasing or decreasing |
|
Updated figure in original comment to show current graph |
Codecov Report
@@            Coverage Diff             @@
##           master     #134      +/-   ##
==========================================
+ Coverage   97.08%   97.14%   +0.06%
==========================================
  Files          95       95
  Lines        2742     2872     +130
==========================================
+ Hits         2662     2790     +128
- Misses         80       82       +2
Continue to review full report at Codecov.
|

evalml/models/auto_base.py
Outdated
| @@ -127,7 +148,10 @@ def fit(self, X, y, feature_types=None, raise_errors=False): | |||
| self.logger.log("\n\nMax time elapsed. Stopping search early.") | |||
| break | |||
| self._do_iteration(X, y, pbar, raise_errors) | |||
|
|
|||
| if plot_iterations: | |||
| new_score = self.rankings['score'].max() | |||
There was a problem hiding this comment.
does this work for metrics where lower is better?
evalml/models/auto_base.py
Outdated
| Returns: | ||
|
|
||
| self | ||
| """ | ||
| def update_plot(fig, ax, iter_scores): |
There was a problem hiding this comment.
let's make sure that there is a function that can be called to get this information if another program wanted to be able to generate this plot.
There was a problem hiding this comment.
we should then write a test case for that function in this PR
evalml/models/auto_base.py
Outdated
| @@ -328,6 +342,31 @@ def describe_pipeline(self, pipeline_id, return_dict=False): | |||
| if return_dict: | |||
| return pipeline_results | |||
|
|
|||
| def plot_best_score_by_iteration(self, interactive_plot=False): | |||
There was a problem hiding this comment.
is it possible to also plot a grey dot for what the current iteration scored. essentially have a scatter plot of scores by iteration and a line ontop showing what the best score was by iteration
…Labs/evalml into perf-by-iter-plot
| title = 'Pipeline Search: Iteration vs. {}'.format(self.data.objective.name) | ||
| data = go.Scatter(x=iter_numbers, y=self.iteration_scores, mode='lines+markers') | ||
| layout = dict(title=title, xaxis_title='Iteration', yaxis_title='Score') | ||
| self.best_score_by_iter_fig = go.FigureWidget(data, layout) |
There was a problem hiding this comment.
is it possible to make sure x-axis is integers greater than 0? doesnt make sense to have decimals for an iteration or -1 (show -1 on first iteration)

There was a problem hiding this comment.
It's possible to set the plot so that it only shows positive values. However, the initial point ends up being cut off.
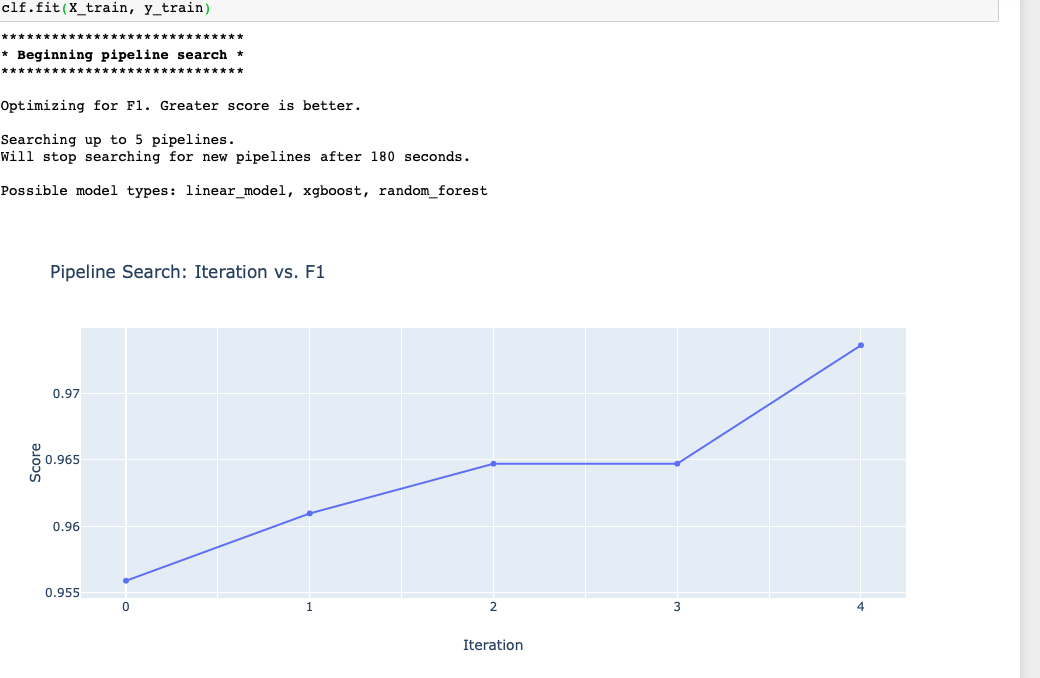
During search:

At the end:
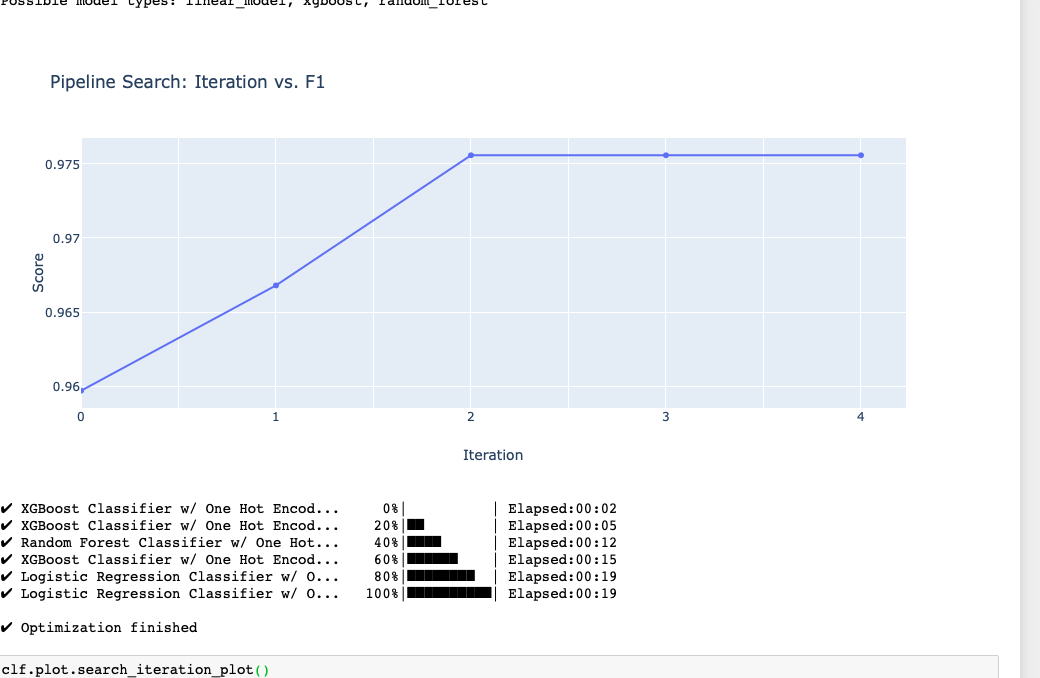
Compared to the original end plot:
Is it worth having it cutoff?
| title = 'Pipeline Search: Iteration vs. {}'.format(self.data.objective.name) | ||
| data = go.Scatter(x=iter_numbers, y=self.iteration_scores, mode='lines+markers') | ||
| layout = dict(title=title, xaxis_title='Iteration', yaxis_title='Score') | ||
| self.best_score_by_iter_fig = go.FigureWidget(data, layout) |
There was a problem hiding this comment.
what if we had this method return a class SearchIterationPlot
then the caller who creates it could call SearchIterationPlot.update()?
i think this is better because add_iteration_score method is a bit confusing out of context and can really only be called if someone calls best_score_by_iteration first
| def best_score_by_iteration(self): | ||
| iter_numbers = list(range(len(self.iteration_scores))) | ||
| title = 'Pipeline Search: Iteration vs. {}'.format(self.data.objective.name) | ||
| data = go.Scatter(x=iter_numbers, y=self.iteration_scores, mode='lines+markers') |
There was a problem hiding this comment.
is it possible to also add a light grey dot for the score of every iteration overlaid on this plot? we don't need to do it in this PR unless it's quick. probably makes sense to just create a new issue for it.
that can be help for users to see what the performance of each successive attempt was yielding
There was a problem hiding this comment.
Added dot to show current position:

There was a problem hiding this comment.
Updated to show dot for every single iteration:

|
@kmax12 It appears that the random plot resizing you were seeing is a chrome specific issue since I was unable to replicate it in safari. I can fix it by turning off the integer-only formatting and manually setting the tick values for every iteration, but then for large runs the axis quickly becomes pretty cluttered.
|

evalml/models/auto_base.py
Outdated
| while time.time() - start <= self.max_time: | ||
| self._do_iteration(X, y, pbar, raise_errors) | ||
| self._do_iteration(X, y, pbar, raise_errors, plot) |
There was a problem hiding this comment.
any reason to not just call plot.update after the self._do_iteration call? might be cleaner not to pass
There was a problem hiding this comment.
I think I wanted to avoid duplicating this call in fit(), but it's probably better to call it twice than to pass it through _do_iteration.
| self.best_score_by_iter_fig.update_layout(showlegend=False) | ||
|
|
||
| def update(self): | ||
| iter_idx = self.data.rankings['id'].idxmax() |
There was a problem hiding this comment.
is this assuming the id can be used to determine pipeline order? that isn't a safe assumption. we recently updated the structure of the the results to make this info assessable in a reliable way
see #260
There was a problem hiding this comment.
Updated to use self.data.results['pipeline_results'] instead
| plot | ||
| """ | ||
|
|
||
| if hasattr(self, 'iter_plot'): |
There was a problem hiding this comment.
i think the logic here might be a bit broken. if you call . search_iteration_plot(interactive_plot=True) twice, the second time you will get the go.Figure instead of the plot returned.
There was a problem hiding this comment.
I chose to do it that way so that users can call search.plot.search_iteration_plot() and get back a Plotly figure after the search process is complete. The first time it is called, it returns the SearchIterationPlot() object so that fit() can update it at every iteration.
The other way I thought of doing this is to separate it out so that there was one function called interactive_search_iteration_plot() that sets up the SearchIterationPlot() object, shows the go.FeatureWidget version, and returns the SearchIterationPlot(). search_iteration_plot() then only returns a Plotly figure for after the search process. Would this be a better implementation?
There was a problem hiding this comment.
hmm, i think i see what you're saying. let's talk live about this briefly tomorrow, so we can wrap this up.
|
based on the issue with formatting, i think it's fine to go back with what you had before. it's better to have negative numbers than to have formatting issue. we can look into fixing it more later. sorry for the wild good chase. |
|
To clarify, the issue is that the odd behavior only comes up when we have the axis set to show integer numbers only. We can still set it to not show negative numbers on the x axis, but the point for iteration 0 would be still cut off slightly. |
| self.curr_iteration_scores.append(self.data.rankings['score'].iloc[iter_idx]) | ||
| iter_idx = self.data.results['search_order'] | ||
| pipeline_res = self.data.results['pipeline_results'] | ||
| iter_scores = [pipeline_res[i]['score'] for i in range(len(pipeline_res))] |
There was a problem hiding this comment.
to make sure these score in the same order as iter_idx, should you do
iter_scores = [pipeline_res[i]['score'] for i in iter_idx]
| plot | ||
| """ | ||
|
|
||
| if hasattr(self, 'iter_plot'): |
There was a problem hiding this comment.
hmm, i think i see what you're saying. let's talk live about this briefly tomorrow, so we can wrap this up.
Updated with tests to check values
Resolves #78
