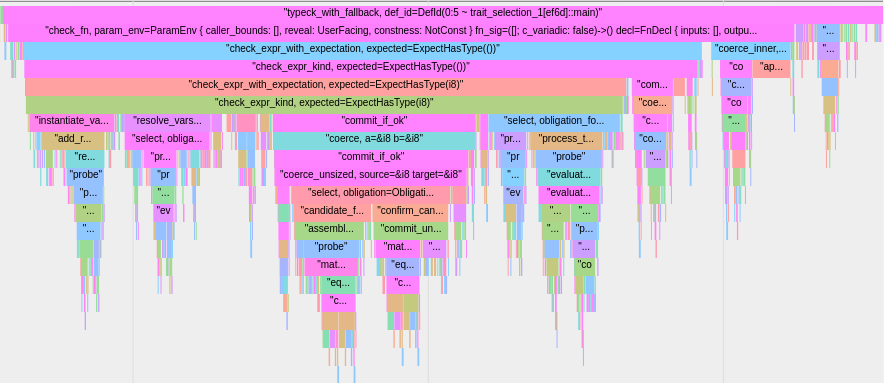
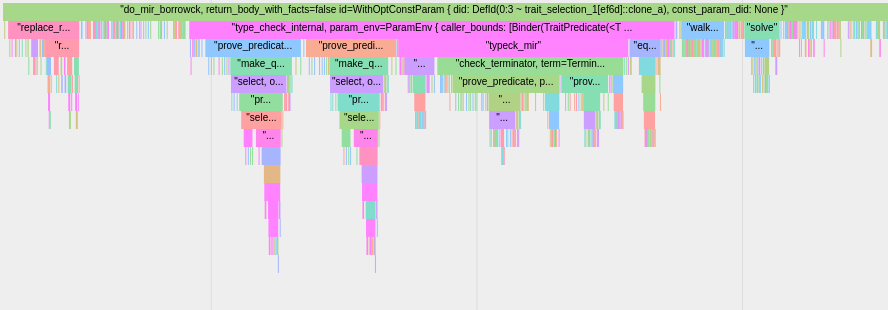
Instrument your application with tracing and libatrace, and get stack view of your application activity with timing information using chrome browser:
After instrumenting your app with tracing, add this subscriber like this:
let subscriber = tracing_subscriber::Registry::default().with(tracing_libatrace::layer().unwrap());
tracing::subscriber::set_global_default(subscriber).unwrap();when running your application, you must run tracing atrace standalone to capture tracing log output,
and then open chrome browser with url chrome://tracing/ to load tracing log and view your application activity with timing and callstack.

