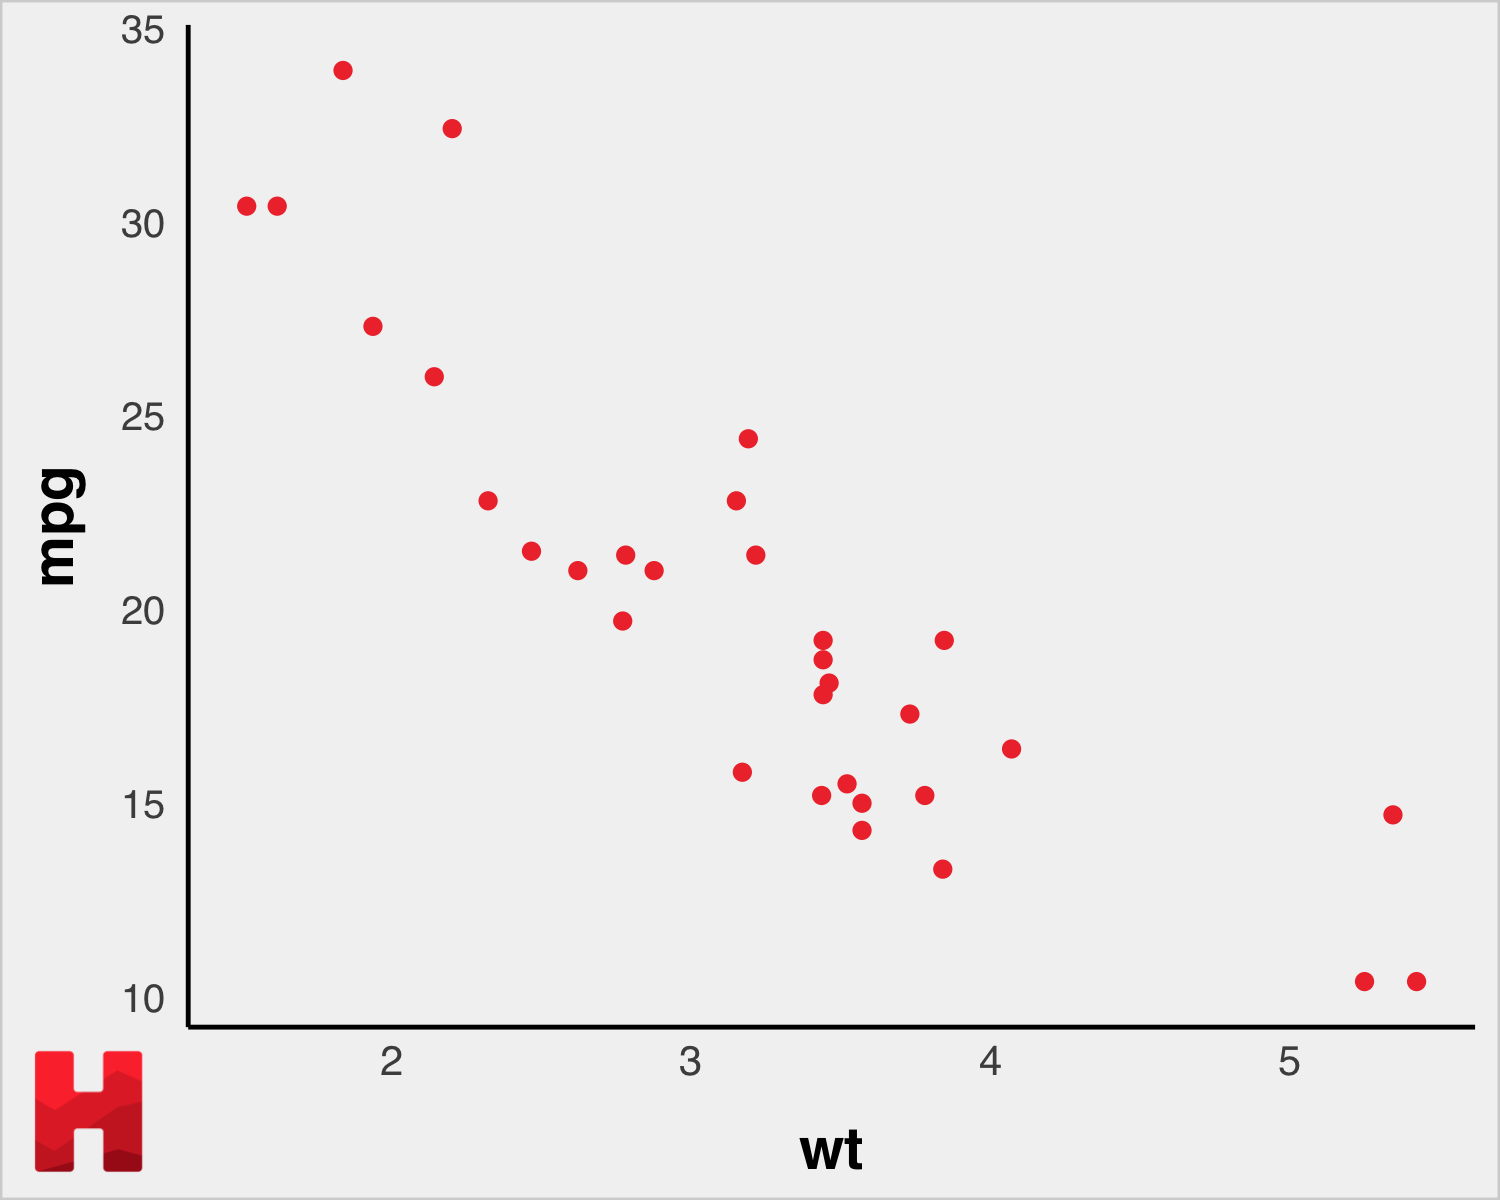
This RHODP package contains a set of functions that are useful when creating ggplot2 plots for HODP articles. Users can access the primary, monochrome, and side-by-side HODP color palettes (see: https://github.com/HarvardOpenData/HODP-StyleGuide/blob/master/hodp-colors-typography.pdf). Users can also quickly add HODP logo to their graphs. An example plot is included below,
 \
Code to generate plot above...
mtcars$cyl <- as.factor(mtcars$cyl)
ggplot(mtcars, aes(x=wt, y=mpg)) +
    geom_point(col = HODPcols('primary')[1]) +
    theme_HODP()   #HODP ggplot theme

# Add logo to existing plot...
add_HODP_logo(width = 1.5)Run the following in R:
#install.packages("devtools")
devtools::install_github("HarvardOpenData/hodp-r-templates")
library(RHODP)