The purpose of this analysis was to create a visual aid for two data sets using Microsoft Excel VBA. We used data from 2017 and 2018 stocks to give Steve and his parents aid on picking stocks that would be best to invest in for the coming year. Twelve stocks were analysed on total daily volume and return percentage. A seperate analysis was done DQ as this information was orgiginally requested to see if this stock was a good investment.
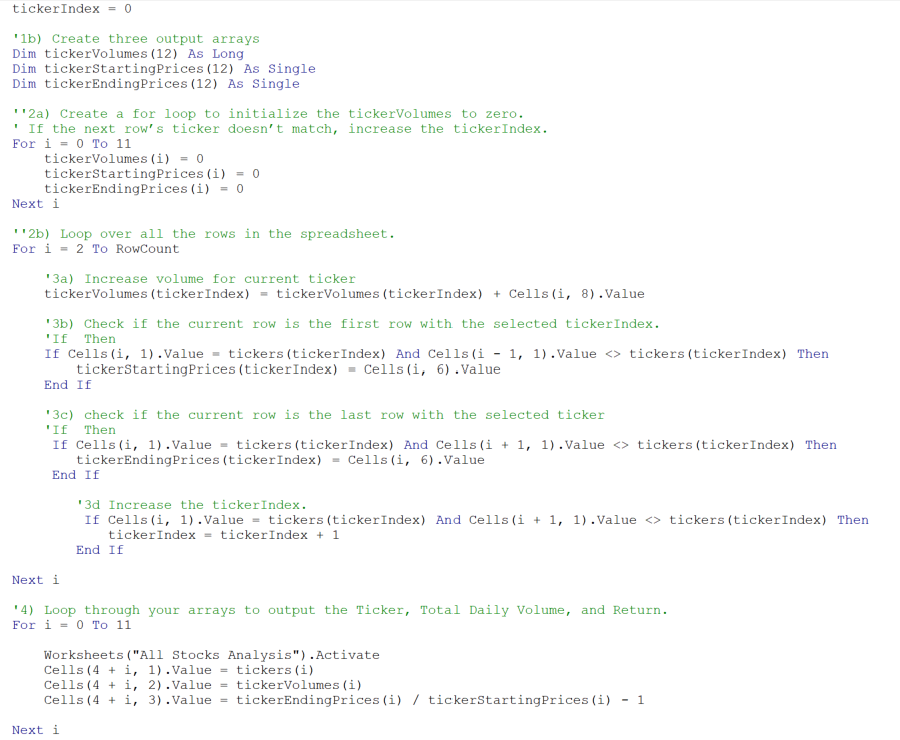
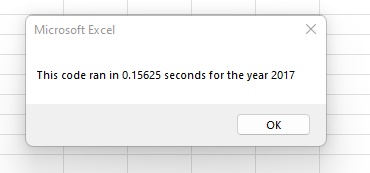
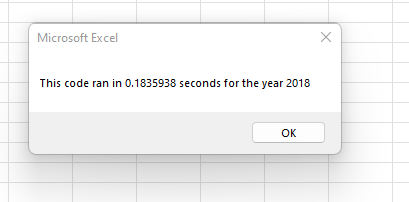
By refactoring the code we were able to conduct the analysis more effeciently. In 2017 and 2018 we were able to see that ENPH and RUN both had a postive return year over year. While the orginal excution times where more the a few seconds the refactoring of the code cut the time to less than a second for both years as illustrated in the images below.
When refactoring code it is easier to understand and less complex. It can be time consuming to even start the process of refactoring. When the orginal script was refactored the pros and cons were aparent.