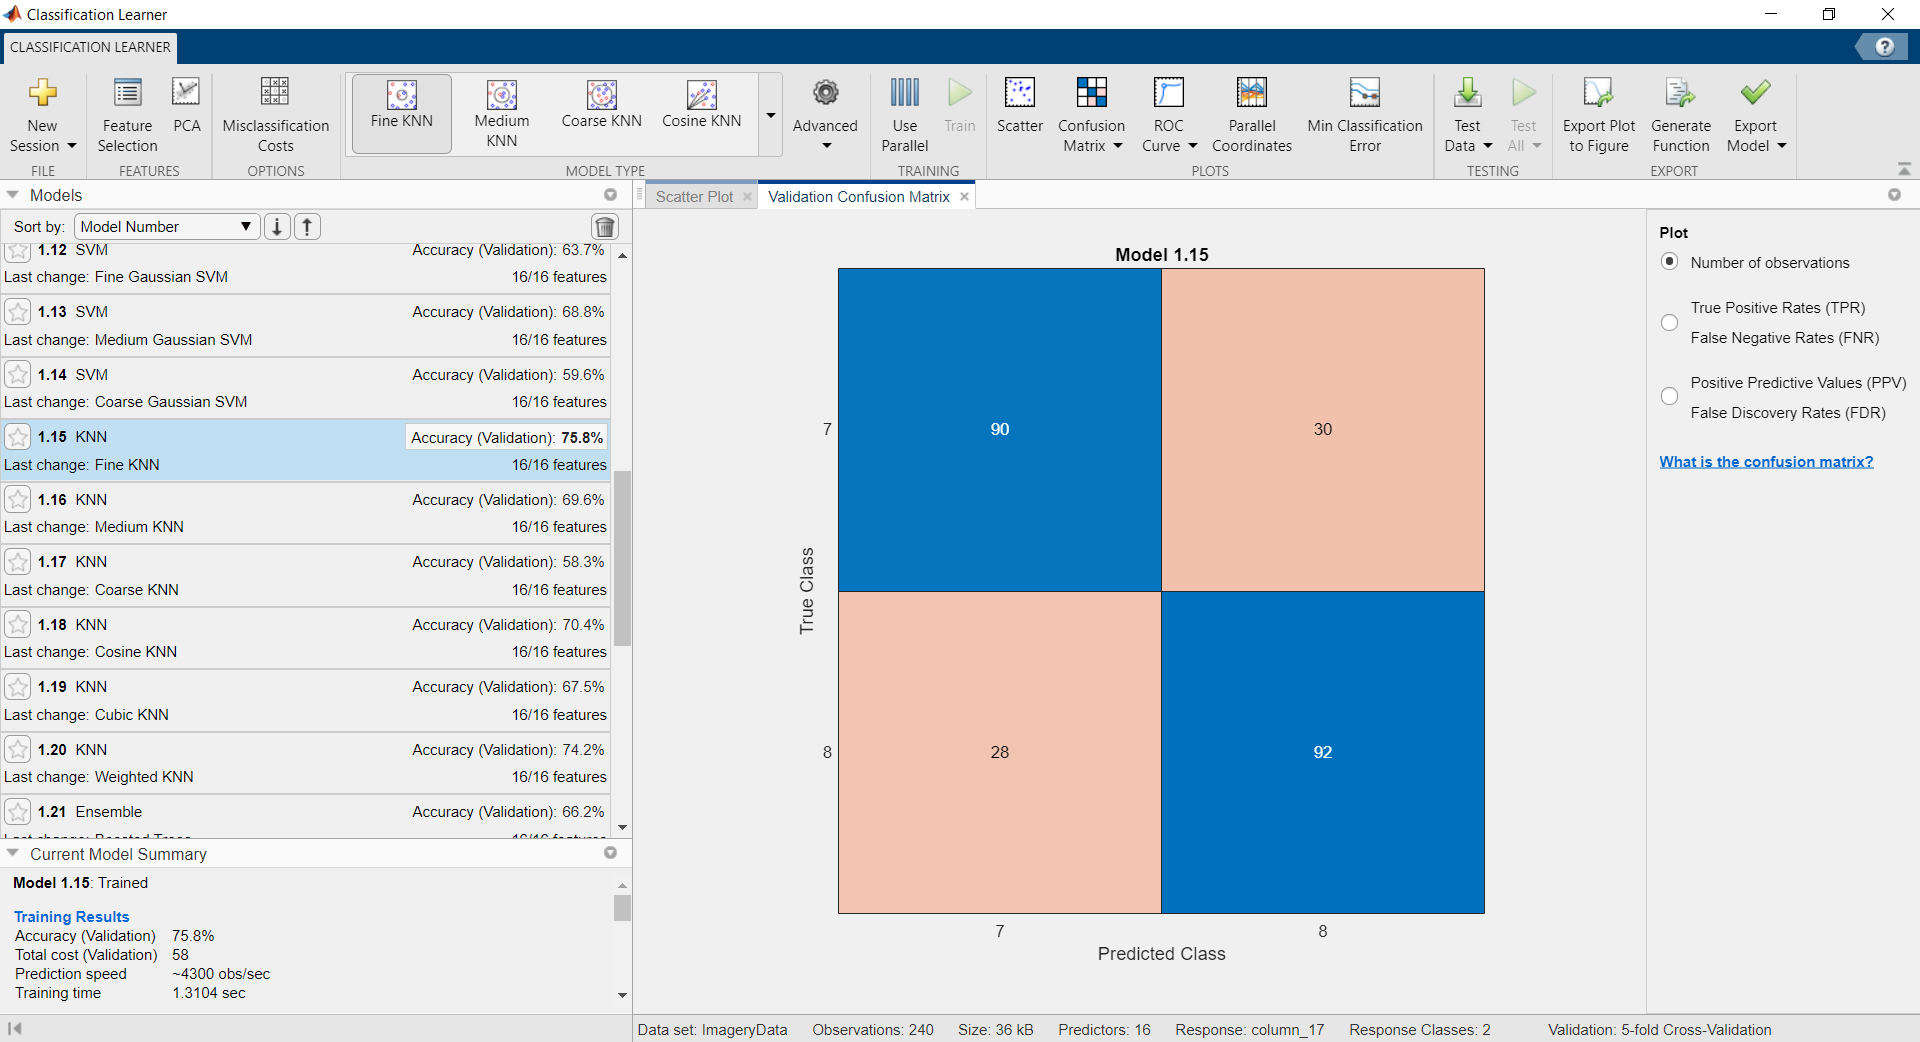
Example of classification with EEG data recorded with OpenBCI
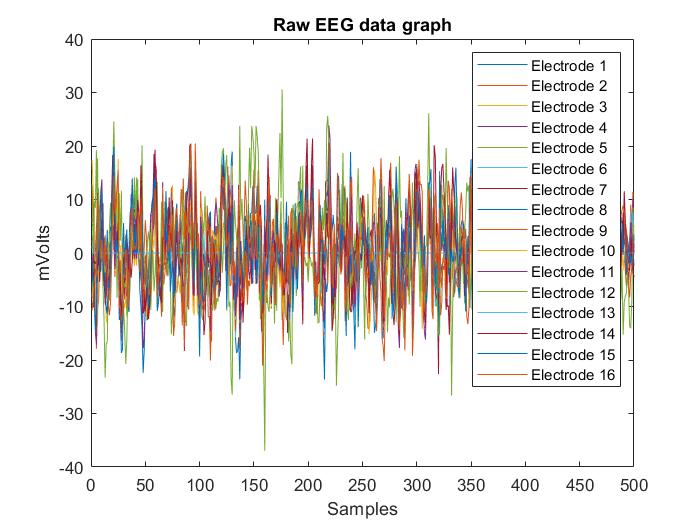
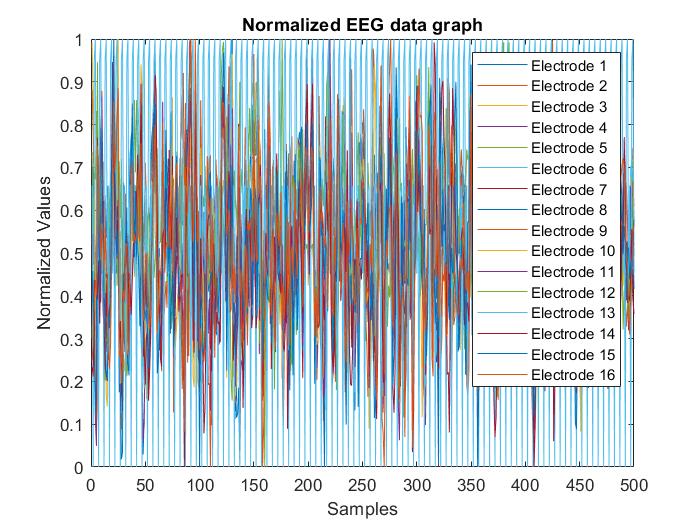
Biomedical Electroencephalography (EEG) signals are the result of measuring the electric potential difference generated on the scalp surface by neural activity corresponding to each brain area. Accurate and automatic detection of neural activity from the upper and lower limbs using EEG may be helpful in rehabilitating people suffering from mobility limitations or disabilities. This article presents a dataset containing 7440 CSV files from 60 test subjects during motor and motor imagery tasks. The motor and motor imagery tasks performed by the test subjects were: Closing Left Hand (CLH), Closing Right Hand (CRH), Dorsal flexion of Left Foot (DLF), Plantar flexion of Left Foot (PLF), Dorsal flexion of Right Foot (DRF), Plantar flexion of Right Foot (PRF) and Resting in between tasks (Rest). The volunteers were recruited from research colleagues at ESPOL and patients at the Luis Vernaza Hospital in Guayaquil, Ecuador. Each CSV file has 501 rows, of which the first one lists the electrodes from 0 to 15, and the remaining 500 rows correspond to 500 data recorded during the task is performed due to sample rate. In addition, each file has 17 columns, of which the first one indicates the sampling number and the remaining 16 columns represent 16 surface EEG electrodes. As a data recording equipment, the OpenBCI is used in a monopolar setup with a sampling rate of 125 Hz. This work includes statistical measures about the demographic information of all recruited test subjects. Finally, we outline the experimental methodology used to record EEG signals during upper and lower limb task execution. This dataset is called MILimbEEG and contains microvolt (µV) EEG signals acquired during motor and motor imagery tasks. The collected data may facilitate the evaluation of EEG signal detection and classification models dedicated to task recognition.
Database for Upper and Lower Limb Task Based on EEG Signals During the Execution of Motor and Motorimagery Tasks
- Journal: https://www.sciencedirect.com/science/article/pii/S2352340923006406?via%3Dihub
- Main Code: https://github.com/Human-Machine-Interface/OpenBCI_Data_Acquisition
- Data Mendeley: https://data.mendeley.com/datasets/x8psbz3f6x/2
- More Matlab Examples: https://github.com/Human-Machine-Interface
- Hardware: FM=16 chanels , Cyton + Dasy , Campling Rate = 125 Hz
- Subjects: 60
We use the OpenBCI Cyton + Daisy (www.openbci.com) [1] Biosensing Board for EEG signal recording. The equipment has an active bandpass filter in the 5 to 50 Hz range, additionally, a notch filter at 60 Hz [1]. This non-invasive device operates within a sampling frequency of 125 Hz and has 16 dry electrodes with two ground references, distributed in the international 10–20 system. All 16 EEG electrodes were recorded in monopolar configuration, in which the potential of each electrode is compared with a neutral electrode located in both lobes of the ears [2]. To guarantee the replicability of the EEG signal recording, the international 10/10 system standardized by the AES was used [10]. The distribution of the 16 electrodes is shown in the figure:


The connections of the electrodes to the Cyton and Dazzy PCBs are as follows:
- Cyton board
- Electrode 1: CH1 (FC5 in 10-10 system EEG)
- Electrode 2: CH2 (F3 in 10-10 system EEG)
- Electrode 3: CH3 (FZ in 10-10 system EEG)
- Electrode 4: CH4 (F4 in 10-10 system EEG)
- Electrode 5: CH5 (FC5 in 10-10 system EEG)
- Electrode 6: CH6 (FC1 in 10-10 system EEG)
- Electrode 7: CH7 (FC2 in 10-10 system EEG)
- Electrode 8: CH8 (CZ in 10-10 system EEG)
- Dazzy board
- Electrode 9: CH1 (T3 in 10-10 system EEG)
- Electrode 10: CH2 (CP5 in 10-10 system EEG)
- Electrode 11: CH3 (C3 in 10-10 system EEG)
- Electrode 12: CH4 (CP1 in 10-10 system EEG)
- Electrode 13: CH5 (CP2 in 10-10 system EEG)
- Electrode 14: CH6 (C4 in 10-10 system EEG)
- Electrode 15: CH7 (CP6 in 10-10 system EEG)
- Electrode 16: CH8 (T4 in 10-10 system EEG)
This is summarized in the following image: