Update examples to use itkwidgets for visualization #22
Conversation
|
Check out this pull request on See visual diffs & provide feedback on Jupyter Notebooks. Powered by ReviewNB |
Updates the IDC segmentation primer and part 3 of the getting started series to
include examples of how to integrate itkwidgets into a notebook.
22ad110 to
92469c6
Compare
Once
For now these notebooks are a blend of both approaches: no output is saved (as is the case with the current notebooks) aside from the viewer screenshots which have been left in. This can be left as-is or modified to include all or no output, whichever option seems best. @fedorov @aylward @thewtex This branch should be in a good place and ready for a final review before merging. |
There was a problem hiding this comment.
I've now been waiting for ~5 minutes, and I still see the spinner in the itkWidgets widget... How long is this step expected to take? Or is something not working?
Reply via ReviewNB
There was a problem hiding this comment.
After I re-ran the cell, I did see the below, which is different from the image included in the static notebook - I think this can be confusing. I also think it will be helpful to include some details how to use user interface to configure visualization (how to show slices, how to do window level).
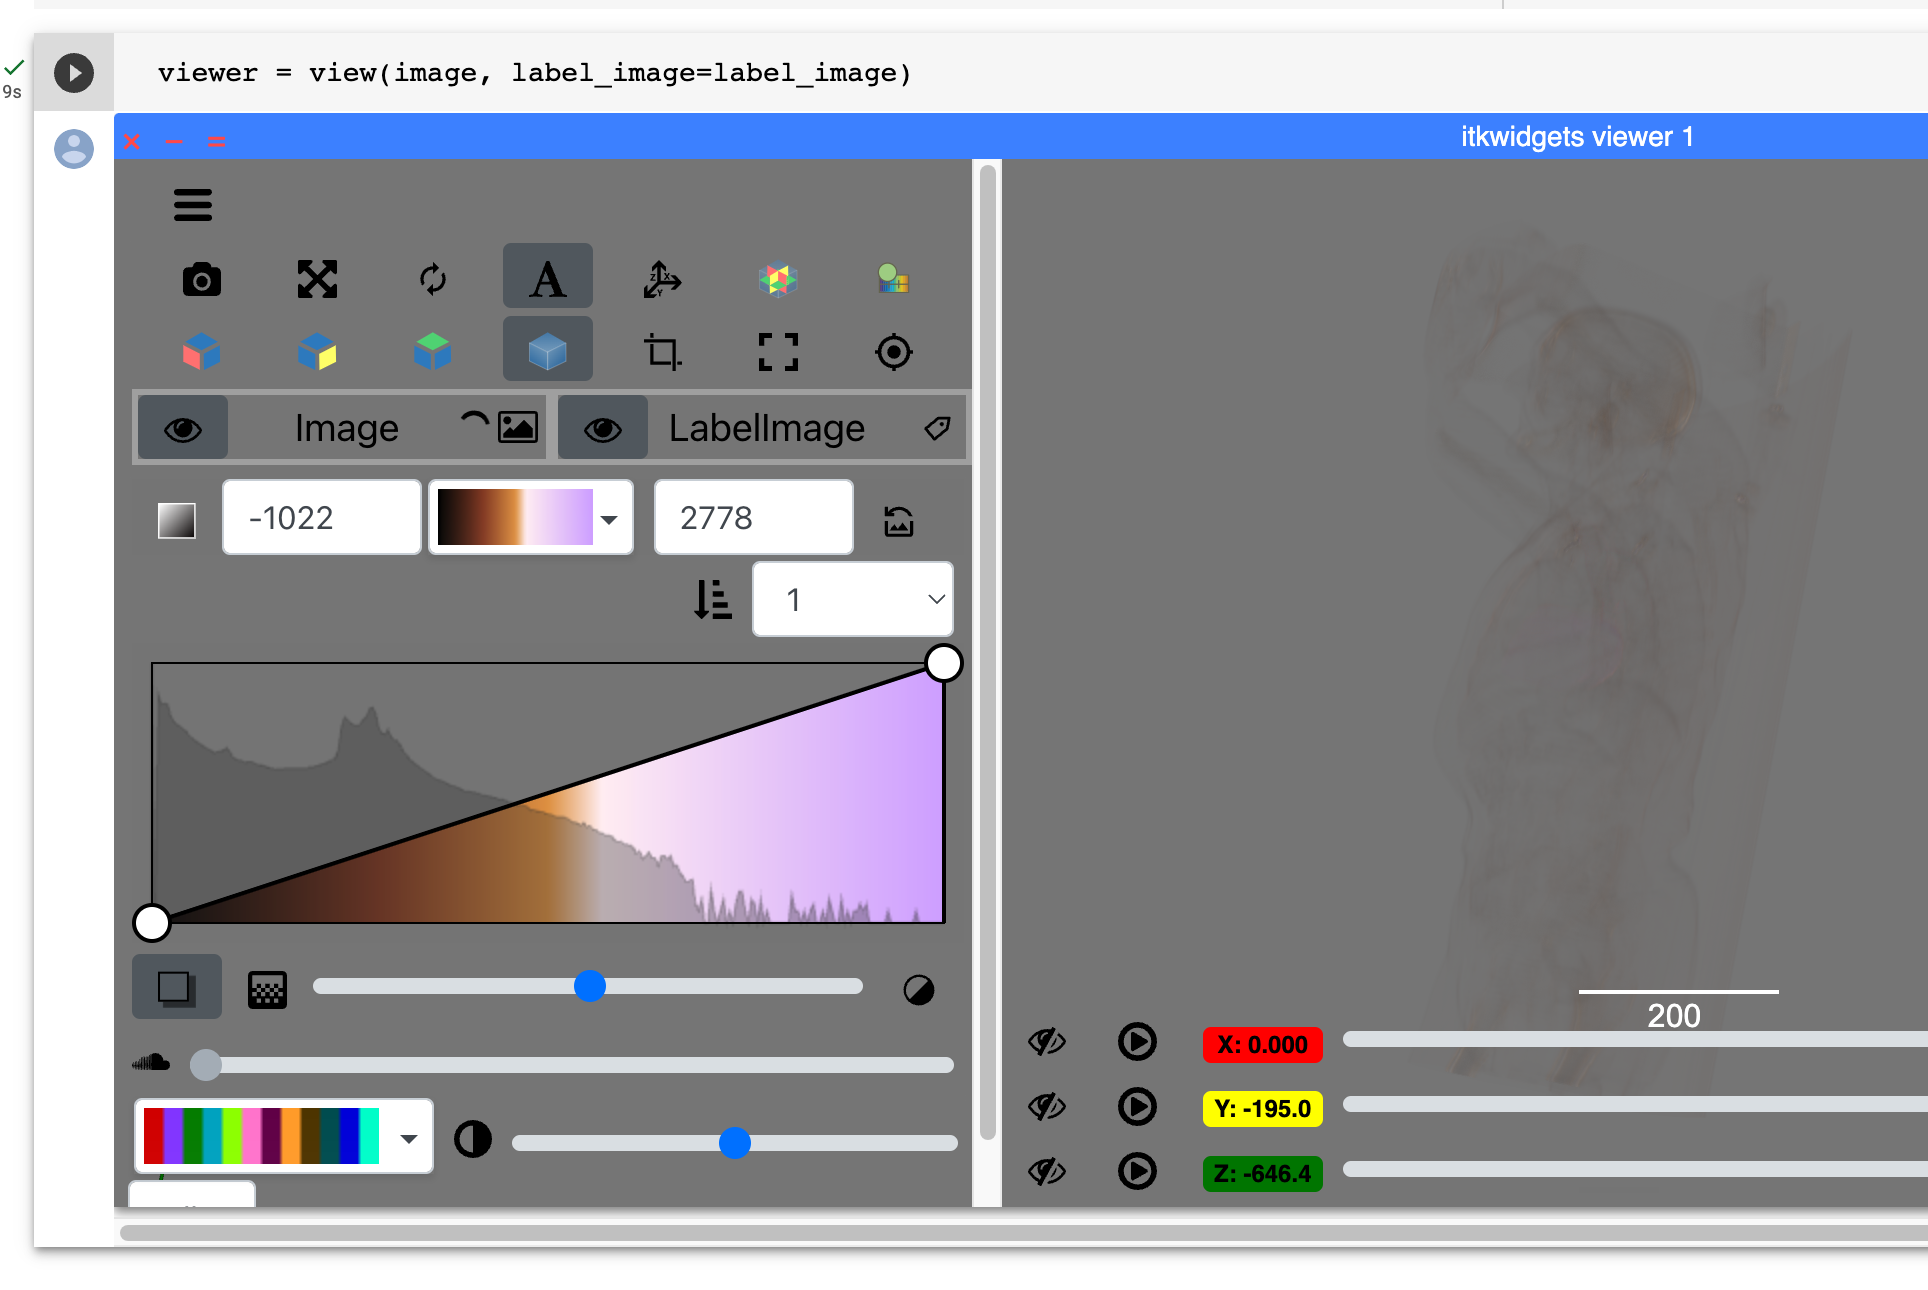
I also noticed that color map assigned to the voxel values when shown in 2D is the same as in 3D volume rendering, which I have to say is very confusing. It took me some time to understand why I see violet shades while trying to adjust w/l in the 2d crossection. This is a comment outside of this PR, but I think it would make sense to have grayscale color map assigned to the 2d view by default. Also, I did figure out how to switch to mouse w/l control, but did not succeed in trying to adjust the w/l to my liking :-(
@bnmajor I made a screen recording to demonstrate my attempts: https://app.screencast.com/wGqulZMcTrZtm. For the sake of comparison, here's how this works in Slicer - a more meaningful initial value for w/l, different sensitivity to the adjustment, and (of course, I am a lot more experienced with Slicer than itkWidgets, but anyway) much shorter time to a nice visualiation: https://app.screencast.com/1GlQnfWvGtVtv. Maybe there are some settings that can be tweaked to improve experience? Also, it looks like itkWidgets does multi-slice projection instead of rendering a single slice. Is that right?
There was a problem hiding this comment.
Thank you so much for the feedback and screencasts @fedorov!
I've now been waiting for ~5 minutes, and I still see the spinner in the itkWidgets widget... How long is this step expected to take? Or is something not working?
That is certainly a case of something not working! It's hard to know what though without any errors. I have noticed that these examples take longer than others I have been testing recently and I will need to do a bit more digging to determine if this is related to the data itself or to Colab (which is typically slower for me in general).
After I re-ran the cell, I did see the below, which is different from the image included in the static notebook - I think this can be confusing.
I will confirm that it is always the same series chosen to prevent possible confusion. In this same vein - the screenshot is a z-slice because the very last cell run updates the viewer to show a slice. I can either a) use the screenshot of the 3D image instead so that it matches the initial visualization or b) separate the two into their own viewers so there will be two different screenshots. Whichever you would prefer.
I also think it will be helpful to include some details how to use user interface to configure visualization (how to show slices, how to do window level).
I can add some examples of these steps!
This is a comment outside of this PR, but I think it would make sense to have grayscale color map assigned to the 2d view by default. Also, I did figure out how to switch to mouse w/l control, but did not succeed in trying to adjust the w/l to my liking :-(
I will certainly raise the idea of a different color map and see what we can do there! As for the w/l adjustment I really appreciate the feedback and example! This is very useful to me in trying to get this right - I will iterate a bit more and keep you in the loop with improvements!
There was a problem hiding this comment.
@fedorov I've added a cell at the end that includes a little more information of the available tools as well as an annotated screenshot with some of the options they will most likely need (changing between slice and volume view, w/l interactor, animation, resolution scale).
There was a problem hiding this comment.
3D visualization is where itkWidgets really shine, so I would definitely include an example of how one can configure the widget to show 3D rendering!
Reply via ReviewNB
There was a problem hiding this comment.
I touched on this in the comment above, but we have a few options here:
- Use the screenshot of the 3D image instead so that it matches the initial visualization
- Separate the two into their own viewers so there will be two different screenshots - one for 2D, one for 3D
- Just stick to the 3D example and users can just toggle to the slice view if they choose
I am open to ideas, whatever you think feels more intuitive!
@thewtex the reason I chose not to save outputs is because some of them may contain items not relevant to the user running the notebook (e.g., name of the project user cannot access), or not of particular interest (e.g., list of downloaded files). But of course, it is completely fine to save selected output cells, if they are helpful - such as screenshot output from the viewer! |
92469c6 to
b5574d6
Compare
|
I've struggled with this before - I think showing a screenshot of the final
image is perhaps appropriate - reflecting intent/outcome rather than an
intermediate step.
…On Wed, Apr 26, 2023 at 9:29 AM Brianna Major ***@***.***> wrote:
***@***.**** commented on this pull request.
------------------------------
In notebooks/getting_started/part3_exploring_cohorts.ipynb
<#22 (comment)>
:
> @@ -1,15 +1,5 @@
{
I touched on this in the comment above, but we have a few options here:
1. Use the screenshot of the 3D image instead so that it matches the
initial visualization
2. Separate the two into their own viewers so there will be two
different screenshots - one for 2D, one for 3D
3. Just stick to the 3D example and users can just toggle to the slice
view if they choose
I am open to ideas, whatever you think feels more intuitive!
—
Reply to this email directly, view it on GitHub
<#22 (comment)>,
or unsubscribe
<https://github.com/notifications/unsubscribe-auth/AACEJL2OLCWTTK32VMXON53XDEPLLANCNFSM6AAAAAAXBT6UVA>
.
You are receiving this because you were mentioned.Message ID:
***@***.***>
--
Stephen R. Aylward, Ph.D.
Senior Director of Strategic Initiatives
Chair of MONAI Advisory Board
---
Kitware: *Delivering innovation.*
|
|
Thank you for the responses, it makes sense, and I am fine with merging this. @bnmajor is this ready to merge, or you are still working on it? |
|
actually, I only checked one of the notebooks, give me a bit more time please .... |
|
Ok, I think I am fine with merging. Just let me know if you want to spend more time working on this. Note that I will need to do updates to account for v14 (our download procedure will switch away from gsutil to s5cmd), so I will need to edit this notebook as well. It will probably be best to merge your updates before I start working on mine @bnmajor! |
b5574d6 to
f1b67ab
Compare
|
@fedorov I've made one final change: adding an annotated screenshot that covers some of the key features (views, w/l, resolution, etc). If that addition looks okay to you I am happy to have this branch merged! |
|
The VolView examples will be much simpler once v14 is out, which will hopefully be this week, but we can fix it later. Thank you for your contribution! |
Updates the
IDC segmentation primerandpart 3of the getting started series to include examples of how to integrateitkwidgetsinto a notebook.@fedorov @thewtex @aylward